Liquidity Is the Only Marketplace Metric That Compounds
A marketplace can grow gross merchandise value for four straight quarters while getting worse at its actual job: matching a buyer with a seller fast enough that both come back. We have watched platforms post 40 percent GMV growth in a year while the share of buyer requests that ever received a quote fell from 31 percent to 19 percent. The board saw a good year. The supply side saw twelve months of silence, and roughly 60 percent of it left.
Marketplace liquidity is the share of listings that transact inside a defined window, and the share of searches that end in a match. Those two numbers are the only ones that compound, because every point of improvement makes the next buyer and the next seller cheaper to keep. GMV does not compound. It is an output, and it can be bought.
This piece covers how to measure marketplace liquidity at the level where it actually lives, the way a marketplace growth audit reads it, the volume you need before a market behaves like a market, what illiquidity costs in dollars, and where to point top-of-funnel growth once you can see the gap.
Marketplace liquidity is two numbers, not a feeling
Liquidity is the probability that a given listing sells and a given search ends in a transaction, inside a window you commit to in advance. Everything else is commentary.
Seller-side liquidity: the share of active listings that transact within 30, 60 or 90 days. Buyer-side liquidity: the share of intentful searches or requests that end in a match. Pick the window by sales cycle. Consumer goods run 30 days. Business-to-business (B2B) equipment and services usually need 90.
Venture investors who underwrite marketplaces treat this as the central question rather than a dashboard nicety, tracking it through fill rate, market depth and time to find a match, as a16z sets out in its marketplace glossary. The wording varies by firm. The intent never does.
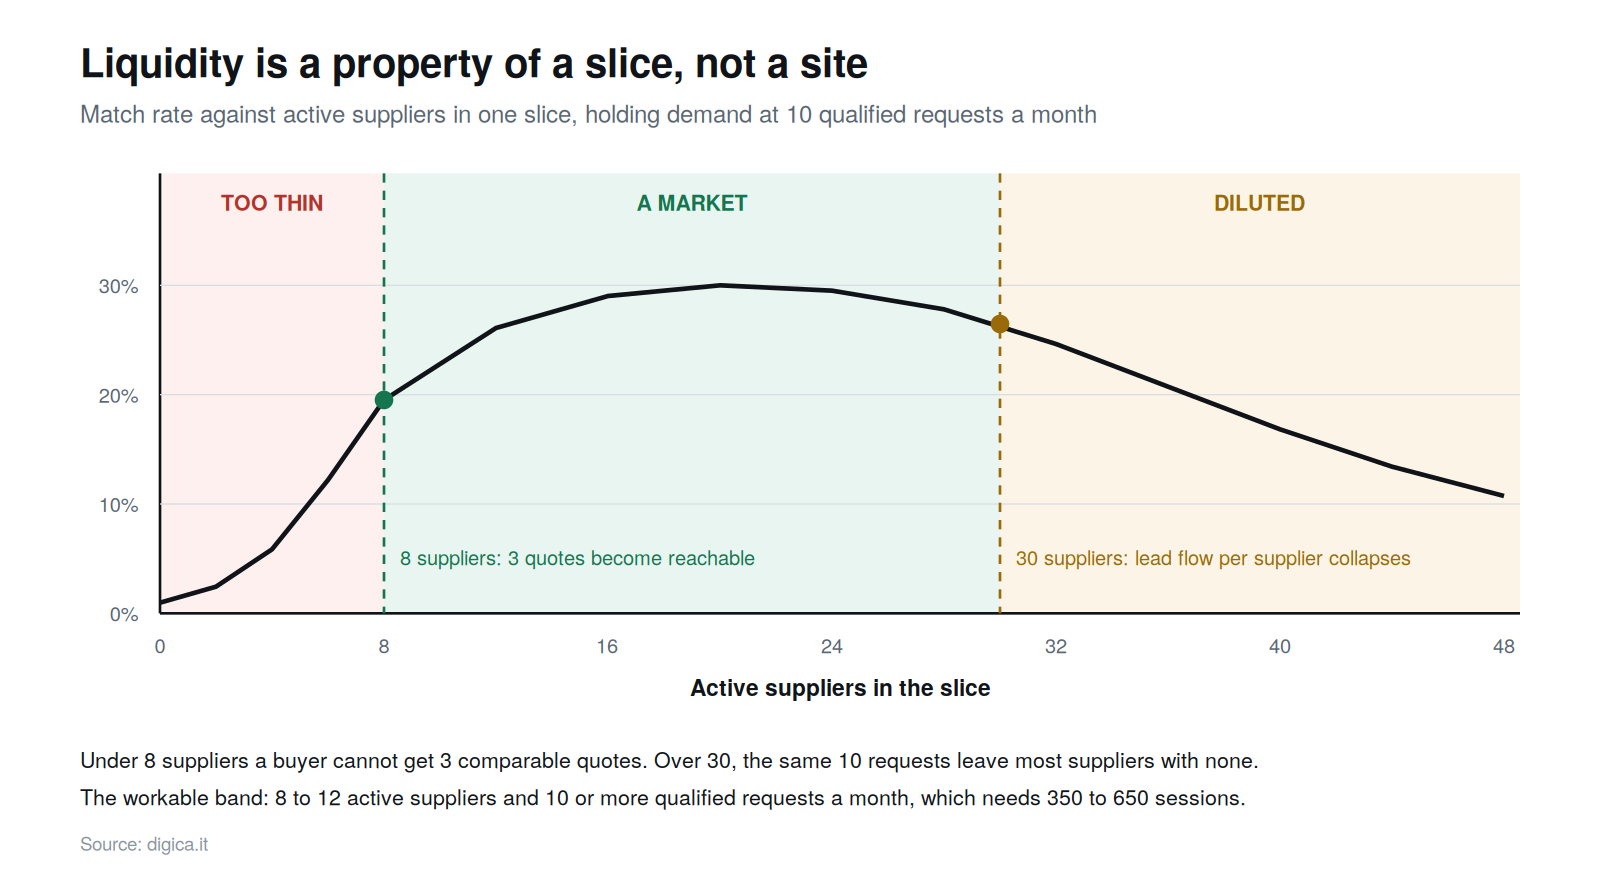
The mistake is measuring it platform-wide. A single blended match rate across every category and region is an average of a few liquid pockets and a long tail of dead ones, and averages hide exactly the thing you need to see. Liquidity is a property of a slice, not a site.
Why GMV flatters and liquidity tells the truth
GMV rises whenever a small number of large sellers get larger. That is not a marketplace improving. That is concentration.
Amazon is the clearest illustration at scale. Marketplace Pulse reports that fewer than 8,000 sellers now generate half of an estimated 300 billion dollars in United States third-party GMV, down from around 15,000 sellers less than three years ago. The top line grew. The odds for an average seller did not.
Run the same test on your own numbers before the next board pack. Strip out your top 20 sellers and your top 3 categories, then recalculate GMV growth. If the remainder is flat or negative, you are not growing a market, you are growing a handful of accounts, and the day one of them goes direct you find out how much of the business was actually yours.
The opinionated version: GMV is a lagging vanity number that can be purchased with discounts, paid media and a single enterprise logo. Match rate cannot be purchased. It has to be engineered.
There is a reporting benefit too. A platform that can show match rate rising while case studies demonstrate the same pattern across slices has a growth story that survives diligence. One that shows GMV alone gets asked, in the second meeting, what the take rate on repeat buyers looks like.
If a buyer has to wait, you have a directory
If a buyer has to wait, you do not have a marketplace. You have a directory with a payment button.
The distinction is operational, not semantic. A directory returns options. A marketplace returns an answer. The variable that separates them is time to first credible response: minutes in ride hailing, hours in consumer rentals, 24 to 72 hours in B2B where a human has to price the job.
Buyers do not file a complaint when this breaks. They go quiet. Across B2B platforms we see the same curve: a buyer whose first request gets two or more quotes inside 48 hours returns at roughly 3 to 4 times the rate of a buyer who gets one quote in a week. The second buyer is not angry. They simply went back to the supplier they already knew, and the acquisition cost of winning them, typically $165 to $700 in paid channels, is spent.
Track time to first response as a distribution, never as an average. The average is dragged down by your three best-run slices. The median and the 90th percentile are where the churn is hiding.
The volume you need before a marketplace behaves like one
A slice behaves like a market at roughly 8 to 12 active suppliers and 10 or more qualified buyer requests per month. Below that, both sides are running an experiment.
The arithmetic is not complicated. A B2B buyer needs 3 comparable quotes to defend a decision internally. Supplier response rates on inbound marketplace requests typically run 30 to 50 percent, so you have to reach 6 to 10 suppliers to land 3 quotes. Reach fewer and the buyer gets one quote, which is worse than useless because it cannot be benchmarked.

Now the supply side, which is the constraint nobody models. A supplier stays engaged at roughly 3 to 4 qualified requests a month. Below 1 a month, 12-month churn in B2B typically runs 55 to 75 percent. If each request is distributed to 5 suppliers, keeping 12 suppliers at 4 requests each needs about 10 qualified requests per slice per month. The two sides land on the same number from opposite directions, which is a useful sanity check rather than a coincidence.
Convert requests into traffic and the growth plan writes itself. Qualified organic sessions convert to requests at 1.5 to 3 percent on well-built category pages. Ten requests a month therefore needs roughly 350 to 650 qualified sessions per slice per month. Twenty slices needs 7,000 to 13,000 sessions a month pointed at the right 20 pages, not 40,000 sessions sprayed across 400.
That is the number worth taking into a planning meeting. Not traffic. Traffic per slice.
What liquidity looked like at Uber, Airbnb and Amazon
The platforms that won did not grow into liquidity. They engineered it inside a small area first and refused to expand until it held.
Ride hailing made the metric physical. The operating target reported across early Uber and Lyft launches was pickup time, kept under roughly 5 minutes and pushed toward 3, because a rider who waits 12 minutes does not open the app again. Drivers, symmetrically, need utilisation high enough to beat their alternative. Neither is achievable with drivers spread thinly across a metro area, which is why launches concentrated supply in a few dense zones and let the map stay empty elsewhere. The trade-off was accepted coverage gaps in exchange for a match rate that held.
Airbnb is the supply-quality version of the same lesson. Early city launches were run one market at a time, and the widely reported 2010 intervention of sending professional photographers to shoot listings lifted bookings sharply for the photographed inventory. The listings existed either way. What changed was whether a search ended in a booking. Presentation quality is a liquidity input, not a branding exercise, and it is one of the few inputs a platform can change without persuading anybody on either side to behave differently.
See where your own liquidity gap sits. Digica runs a slice-level growth audit that maps supplier density, request volume and match rate before anyone writes a page. Request a growth audit
Amazon shows the failure mode at maturity. Enormous aggregate demand coexists with a seller base where a small minority captures most of the GMV, so a new entrant in a crowded category can hold live listings for months with no transactions at all. Aggregate liquidity is excellent. Slice-level liquidity, for that seller, is close to zero. Both statements are true simultaneously, which is precisely why the blended number misleads.
None of this is a chicken-and-egg problem, and the pitfalls that kill marketplaces mostly arrive after critical mass rather than before it, as Hagiu and Rothman set out in their analysis of why network effects are not sufficient. Growing too fast, too early is top of their list.
The pattern that recurs across marketplaces of every size: liquidity is won by deliberately shrinking the map until the density is real, then expanding one slice at a time. Nobody has ever achieved it by adding categories faster.
What illiquidity costs, in dollars
Illiquidity is not a soft problem. It shows up as supply re-acquisition spend, wasted demand spend and suppressed take rate.
Start with supply. Onboarding an activated B2B supplier costs $130 to $435 when it involves any human contact, verification or catalogue work. A 300-supplier platform running at 60 percent annual churn loses 180 suppliers a year and pays roughly $49,000 to replace inventory it already had. The suppliers did not leave over price. They left because the leads never came.
Demand spend is the second leak. Paid acquisition in B2B categories runs $4 to $11 per click, and at a 1.5 to 3 percent request rate that is $165 to $700 per qualified request. Send those requests into a slice with 4 suppliers and a 40 percent response rate, and more than half produce no quote at all. You paid full price for a request the platform could not serve.
Then take rate. A buyer who receives 3 quotes accepts platform-mediated payment and stays inside the funnel. A buyer who receives one quote takes the conversation off-platform, and the transaction that would have produced 8 to 12 percent of an $8,700 order, call it $700 to $1,050, produces nothing.
Put the three together on a mid-size platform and the annual cost of illiquidity typically lands between $165,000 and $435,000, most of it invisible because it is spread across three budget lines owned by three different people.

Three ways to close a marketplace liquidity gap
There are three levers, and they are not interchangeable. Choosing wrong costs a quarter.
Paid demand injection. Cost per qualified request: $165 to $700. Time to effect: 2 to 4 weeks. Main risk: it stops the day you stop paying, and trains nobody. Effect on supply churn: temporary relief. Best for: proving a slice can convert before investing in it. Payback: none, it is a running cost.
Concentrating existing traffic. Cost per qualified request: $45 to $130 by month 12. Time to effect: 4 to 9 months. Main risk: slice selection has to be right before you commit. Effect on supply churn: structural, because requests keep arriving. Best for: slices already at 6 or more suppliers with demand under 10 requests a month. Payback: 9 to 14 months, then compounding.
Narrowing the slice. Cost per qualified request: near zero, it is an editing decision. Time to effect: 1 to 2 weeks. Main risk: coverage looks thinner to investors and to buyers outside the slice. Effect on supply churn: immediate, because fewer suppliers share the same requests. Best for: slices with 30 or more suppliers and under 5 requests a month. Payback: immediate, but it caps upside.
Which lever applies is decided by data only you hold: supplier counts and request volume, slice by slice. If those numbers are hard to put together, that is usually the finding, and a fixed-scope liquidity review exists to produce it in two weeks.
Most teams reach for paid because it is fast and legible. It is the right call only as a test instrument. Running paid demand into an illiquid slice for a year is paying rent on a problem instead of fixing it.
The combination that works: narrow the slice this month, prove conversion with a small paid budget over the next quarter, then point durable organic demand at the proven slices. That sequence has a payback period of 9 to 14 months and leaves you with an asset instead of an invoice.
Where marketplaces break their own liquidity
Every one of these is a decision someone made, not bad luck.
Expanding categories to make the catalogue look complete. A platform adds 12 categories to satisfy a partner pitch. Demand stays flat, so requests per supplier fall by two thirds and the original liquid slices get diluted by irrelevant supply in search results. Cost: roughly $49,000 in supply re-acquisition the following year, plus a match rate that fell from 28 to 11 percent. The right call was to add zero categories and double the request volume in the four slices that were already working.
Optimising the blog for volume instead of intent. Six months of top-of-funnel content produced 30,000 sessions a month against terms with no purchase intent. Requests moved by under 5 percent. The $52,000 spent bought an audience that was never going to transact. The right call was 20 commercial category pages mapped one to one with the slices where supply already existed.
Onboarding supply faster than demand. Sales teams get paid for suppliers, so suppliers arrive. A slice goes from 12 suppliers to 60 with the same 10 monthly requests, per-supplier lead flow drops from 4 to under 1, and churn runs above 70 percent. The right call was a supply cap per slice tied to request volume, which is unpopular with a sales team and correct anyway.
Treating response time as a supplier problem. Suppliers answer quickly when the lead is worth answering. Requests that arrive unqualified, unpriced and blasted to 20 recipients get ignored, and the platform concludes its suppliers are lazy. Request quality is the platform's job, and treating it as the supplier's is how a fixable matching problem becomes a churn problem.
Not sure which of your slices clear the threshold? The audit produces the supplier-count and request-volume table for every slice you run. Request a growth audit
The common thread is that all four decisions looked like growth in the meeting where they were approved. More categories, more traffic, more suppliers and faster supplier response all read as progress on a slide. Each one, applied to a slice that was already thin, made the match rate worse and the churn faster. Liquidity is the only measurement that tells you afterwards which of your growth decisions were real, which is why it belongs on the same page as the GMV number rather than three tabs away.
Top of funnel is a liquidity lever, not a vanity one
Traffic is either a liquidity input or it is decoration. The difference is whether it lands in a slice with supply waiting.
This is where most content programmes fail commercially while succeeding editorially. They produce sessions against informational queries, report the sessions, and never map a single page to a slice that can actually fulfil a request. A page ranking for how a process works attracts people six months from a purchase. A page ranking for the commercial query, the category plus the region plus the specification, attracts someone with a budget line open now.
Rank the slices before writing anything. Supply density first, search demand second, current match rate third. Write for the slices where suppliers are already sitting idle, because those convert on the first visit and lift supplier retention at the same time. One page can raise both sides of the ratio.
The reporting discipline that follows: no content metric gets presented without the matching request count for its slice. Sessions per slice, requests per slice, match rate per slice, side by side. It takes one dashboard change and it ends the argument about whether the content programme is working in about ten minutes.
Expect the honest timeline. Commercial category pages in B2B verticals take 4 to 9 months to reach stable positions, which is why the paid test runs first and why the budget conversation has to happen before, not during.
The decision framework: thresholds worth acting on
Apply these in order. Each one is a number, not a discussion.
If a slice has under 8 active suppliers, do not point demand at it. Fix supply first, or fold the slice into a broader one until it clears the threshold.
If a slice has 8 to 30 suppliers and under 10 qualified requests a month, it is demand-constrained. This is the only situation where top-of-funnel investment pays back inside a year.
If a slice has over 30 suppliers and under 5 requests a month, narrow it or cap onboarding now. Adding traffic to a 60-supplier slice with 5 requests spreads the same lead flow thinner and accelerates churn.
If match rate sits under 10 percent while supply and demand both look adequate, the problem is matching quality, not volume. Look at response time distribution and request qualification before spending anything.
If time to first response exceeds 72 hours at the median in B2B, freeze acquisition spend entirely until it is under 48. Every dollar of demand spend is leaking out through a hole you already know about.
If 3 or fewer slices produce over 60 percent of transactions, you have a concentration risk, not a marketplace. Revenue concentration tightens over time rather than loosening, a dynamic Marketplace Pulse documents across Amazon's seller base. Build the next 3 before adding the next 30.
Rerun the whole set quarterly. Slices move, and a slice that cleared the threshold last year can quietly fall below it after a few supplier departures.
What liquidity is worth on the same traffic
The commercial case is easier than most people expect, because it is measured on traffic you were going to acquire anyway.
Take 1,000 qualified organic sessions in a B2B slice. At a 2 percent request rate that is 20 requests. In a liquid slice with a 12 percent fill rate, that produces 2.4 transactions at an $8,700 average first order, roughly $20,900 of GMV and about $2,090 of take-rate revenue at 10 percent. In an illiquid slice at a 4 percent fill rate, the same 1,000 sessions produce 0.8 transactions, around $7,000 of GMV, and about $700 of revenue.
Want the arithmetic run on your own numbers? Bring your slice list and we will size the gap in one call. Book a call
Same traffic. Same cost of acquisition. Three times the yield, determined entirely by whether the slice had supply density before the visitor arrived. That ratio is the whole argument for sequencing liquidity work ahead of volume work, and it is why the growth plan should start from the match-rate table rather than the keyword list.
If you point next year's 60,000 incremental organic sessions at 20 liquid slices instead of spreading them across the catalogue, you generate roughly $125,000 in take-rate revenue rather than $42,000, on identical traffic and identical spend. The difference, about $83,000 a year, pays back a full-year content and category programme inside 9 to 14 months. The biggest cost of doing nothing is quieter: 180 of 300 suppliers leaving over twelve months at $270 each to replace, $49,000 spent to stand exactly still, every year, forever.
FAQ
What is marketplace liquidity?
Marketplace liquidity is the probability that a listing transacts and that a search ends in a match, measured inside a fixed window. Practically, it is two numbers: the share of active listings that transact in 30 to 90 days, and the share of intentful searches or requests that result in a transaction.
How do you measure marketplace liquidity?
Measure it per slice, meaning category plus geography plus price band, never platform-wide. Track fill rate on the buyer side, listing transaction rate on the seller side, and time to first credible response as a distribution. A blended platform average hides the dead slices inside the healthy ones.
What is a good match rate for a B2B marketplace?
Benchmarks vary widely by category, from under 5 percent on broad e-commerce style search to over 80 percent on tightly qualified bottom-of-funnel requests. For B2B request-for-quote models, a fill rate above 25 to 30 percent within 90 days indicates a slice that works. Consistency across slices matters more than the headline figure.
How many suppliers does a marketplace category need?
Roughly 8 to 12 active suppliers per slice, paired with at least 10 qualified buyer requests a month. Buyers need 3 comparable quotes and response rates run 30 to 50 percent, so you need 6 to 10 reachable suppliers per request. Suppliers need 3 to 4 requests a month to stay.
Why is GMV a misleading marketplace metric?
GMV rises when a few large sellers grow, when discounting increases volume, or when one enterprise account lands, none of which means the market is working better. Strip out the top 20 sellers and top 3 categories and recalculate: if growth disappears, the platform is concentrating rather than compounding.
Does SEO actually improve marketplace liquidity?
Only when the pages map to slices where supply already exists. Commercial category pages pointed at slices with 8 or more idle suppliers lift requests and supplier retention together. Informational content that ranks for non-commercial queries raises sessions and moves match rate by almost nothing.
How long does it take to fix a liquidity gap?
Narrowing a slice or capping supply onboarding takes 1 to 2 weeks and shows up immediately in requests per supplier. Paid demand tests show signal in 2 to 4 weeks. Durable organic demand in B2B categories takes 4 to 9 months to reach stable positions, with payback typically at 9 to 14 months.