Marketplace Go-To-Market When Both Sides Are Customers
A marketplace go-to-market plan has to fund two acquisition motions out of one budget, and the unit costs are not close. Onboarding a supplier who actually responds to requests runs $150 to $600 in most B2B categories. Producing a qualified buyer request runs $200 to $900. The gap tempts teams into the cheaper motion first, and the cheaper motion is usually the one that does nothing for growth on its own.
The uncomfortable part is that both numbers are meaningless in isolation. A buyer request arriving in a category with four providers is not revenue, it is a refund and a lost account. A supplier onboarded into a category with no buyer flow churns inside two quarters. What decides the outcome is not which side costs less, it is the order the two motions run in and how narrow the first one is. Most plans get the order right by instinct and the narrowness wrong by a factor of ten.
This piece covers what each side costs, what density has to look like before demand spend converts, how to pick the one category to concentrate on, and how to report a two-sided funnel without flattering it. It is written for platforms with a product in market and a growth budget that has to produce something visible inside four quarters. If you want the shape of the problem on your own numbers, our marketplace growth audit is built around exactly this sequencing question.
Why single-buyer GTM playbooks break on a marketplace
A standard B2B go-to-market plan optimises one funnel: define the ideal customer, build the demand engine, measure cost per acquisition against lifetime value. A marketplace runs that exercise twice, against two populations that value the platform for opposite reasons, and then has to keep the two in ratio to each other. Buyers want choice and speed. Suppliers want volume and margin. Give either side too much of what it wants and the other side leaves.
The scale of the prize is why this keeps attracting capital and impatient boards. Statista puts the global B2B e-commerce market at roughly 33.7 trillion dollars in 2026, growing toward 48.1 trillion by 2030, and vertical platforms are taking a rising share of it. That number is also why so many plans start with demand: the addressable market looks infinite, so spending against it feels obviously correct.
The failure mode is quiet. Demand spend in a thin category does not produce zero, it produces a small number of requests that go unanswered, a first-visit experience the buyer will not repeat, and a conversion rate that looks like a creative problem. Teams respond by changing the ads. The problem was never the ads.
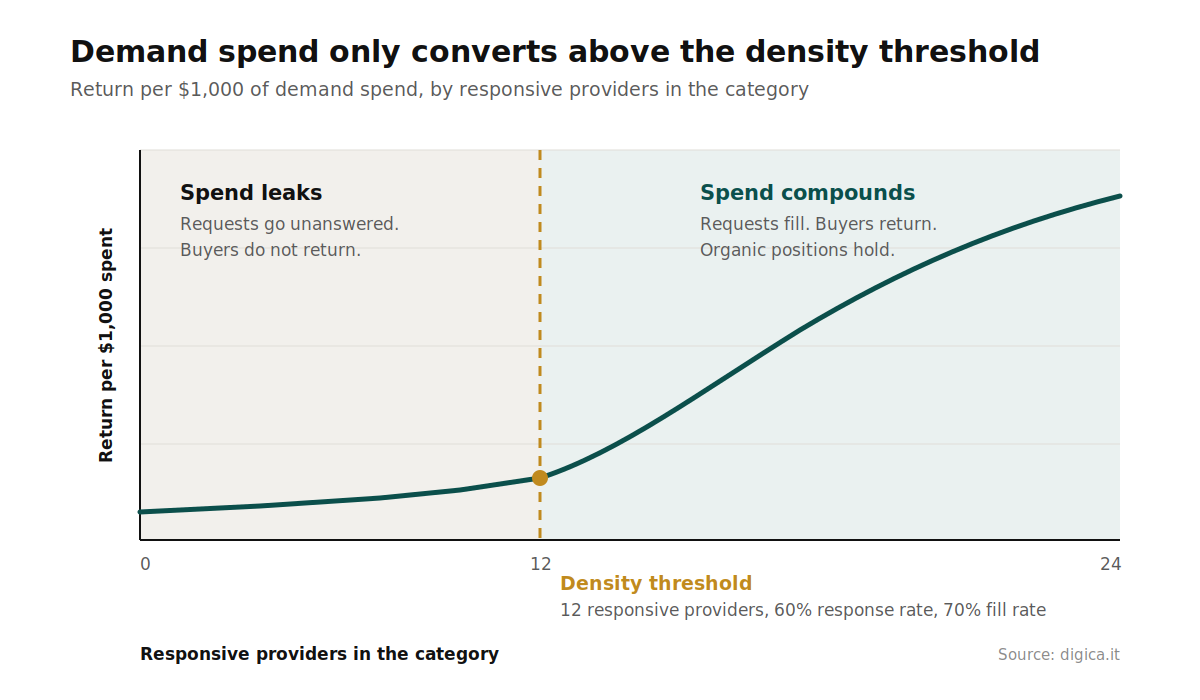
There is a structural reason the single-funnel habit survives. Most growth leaders arrived from SaaS, where the funnel really is one-sided and where more spend genuinely does mean more pipeline. On a marketplace, spend above the density threshold is the only spend that compounds. Everything below it is rented traffic with a leak at the bottom.
The cheapest side to acquire is rarely the side that unlocks growth
The side that is cheap to acquire is cheap because it is already motivated. Suppliers who want leads will fill in a profile for free. That is not the same as being the side that makes the platform work, and confusing the two is the most expensive mistake in marketplace growth.
Andrew Chen's framing of the hard side is the useful one here. One side of every network does the work that makes the network valuable, and that side is always harder to acquire and harder to retain. On most B2B marketplaces the hard side is not "suppliers" in general, it is responsive suppliers: the ones who answer a request inside 24 hours with a real quote. They are a small fraction of registered supply and they are the entire product.
Registered supply is a vanity number. Responsive supply is the asset. A category with 400 registered providers and 11 that answer is a category with 11 providers, and buyers will work that out faster than the dashboard does.
This is why the acquisition comparison has to be made against responsive supply rather than sign-ups. Measured that way, the cost of a working supplier is rarely $150. It is $150 for the sign-up plus the onboarding time, the first response coaching, and the churn of everyone who never answers. Loaded properly, the number lands between $400 and $1,200 per responsive supplier in a specialist B2B category, which changes the entire budget conversation.
What density actually means, in numbers
Density is the point at which a buyer arriving cold gets a usable answer without anyone intervening. It is measurable, and the thresholds are more consistent across verticals than most teams expect.
Three numbers define it. Responsive providers per category, which needs to sit at 12 or above before a request reliably fills. Response rate inside 24 hours, which needs to hold above 60 percent. And fill rate, the share of buyer requests that receive at least three quotes, which needs to clear 70 percent before demand spend converts predictably.
Below those lines, every additional dollar of demand spend has a leak in it. Above them, the same dollar buys a buyer who comes back. The gap between a 40 percent fill rate and a 75 percent fill rate is roughly the difference between a 1.5 percent and a 6 percent request-to-transaction rate in most B2B categories, which is a 4x swing in the effective cost of every acquired buyer.

The practical consequence is that density is a gate, not a goal. It is the thing that has to be true before the growth plan is allowed to spend, and it is cheap to reach inside one narrow category and ruinously expensive to reach across a full catalogue. A platform with 14 categories and 200 responsive suppliers has nothing. The same 200 concentrated into two categories has a business, and the difference in acquisition cost between those two states is zero. Only the allocation changed.
What each side costs, side by side
Three sequencing options exist, and the cost profiles are different enough that the choice should not come down to preference. Supply-first concentrates spend on responsive providers in a narrow category and opens demand against that density. Demand-first buys buyer requests and uses the demand signal to recruit supply. Balanced growth funds both at once and is the most common plan in a deck and the least common one that works.
Supply-first, narrow category. Cost to reach a working category: $60,000 to $140,000. Time to first reliable fill rate: 4 to 7 months. Loaded cost per responsive supplier: $400 to $1,200. Main risk: the category is chosen too small to scale. Best for: vertical platforms with fragmented supply. What usually breaks it: impatience at month four.
Demand-first. Cost to reach a working category: $120,000 to $300,000. Time to first reliable fill rate: 9 to 16 months, often never. Loaded cost per responsive supplier: $900 to $2,500. Main risk: paying twice for the same buyer. Best for: categories where supply is already aggregated elsewhere. What usually breaks it: buyer churn after an unanswered request.
Both sides at once. Cost to reach a working category: $200,000 to $450,000. Time to first reliable fill rate: 8 to 14 months. Loaded cost per responsive supplier: $600 to $1,800. Main risk: budget spread below threshold on both sides. Best for: funded platforms with one proven category already dense. What usually breaks it: reporting that hides which side is short.
A procurement lead should be able to read those three routes alone and see the trade. Supply-first is not cheaper per unit, it is cheaper in total, because it reaches a working state before the expensive channel spend starts. Demand-first is not wrong in every case: where supply already aggregates somewhere else, a directory or an association or an incumbent platform, buying demand first can be the faster route, because recruitment then has a real request to point at.
The classic platform pricing work in Harvard Business Review makes the same point from the economics side: in a two-sided network someone has to be subsidised, and the subsidised side is chosen deliberately rather than discovered by accident. Eisenmann, Parker and Van Alstyne's strategies for two-sided markets is 20 years old and still the clearest statement of why a marketplace cannot price both sides as if each were a standalone customer. Most B2B platforms subsidise supply without deciding to, by giving away listings and then wondering why the take rate will not move.
Constrain the category before you scale the channel
The instruction that matters is narrower than most teams are comfortable with. Pick one category, defined tightly enough that a buyer would describe it in a single phrase, and concentrate every supply dollar there until the density numbers clear. Then open demand against that category alone, not against the catalogue.
Narrow means narrower than the org chart. Not "AI sales tools" but "AI SDR agents for outbound teams running fewer than 20 reps". Not "marketing software" but "attribution for product-led SaaS". The test is whether a buyer's search query and your category page are the same sentence. If the page has to list eight subcategories to cover the term, the category is too wide to reach density inside two quarters.
A growth audit shows which single category is closest to density, and what it costs to get it over the line.
The channel plan follows the category, and this is the part that gets skipped. A constrained category makes every channel cheaper at once. Paid search targets 30 to 60 commercial terms instead of 600, which drops blended cost per click from the $5 to $16 range toward $3 to $8.
Content targets one buying decision, so a set of 8 to 12 pages covers the whole question rather than sampling it. Outbound to buyers carries a specific claim, that there are 20 responsive suppliers ready to quote in this exact niche, which is a claim a procurement manager can check in one visit.
Compare that to the catalogue-wide launch. The same budget spread over 14 categories buys 40 to 80 commercial terms per category, no depth in any of them, and a content programme that produces one thin page per category and nothing that ranks. The spend looks identical in the P&L. One version produces a category you own and can extend from, the other produces a traffic line that stops the month the budget stops.
The compounding argument is the one that belongs in front of a board. A dense category keeps working after the spend pauses, because buyers return and organic positions hold. A thin catalogue does not. That is the whole case for sequencing, and it is worth more than any efficiency gain inside the channel itself.
Three ways the sequence gets run backwards
Demand opened at 30 percent fill rate. A platform hits a traffic target, turns on paid and outbound, and generates 400 buyer requests in a quarter. Fewer than half get three quotes. The cost is not the wasted media, which might be $40,000 to $90,000. It is that 200 or more buyers now have direct evidence the platform does not work, and reacquiring a burned B2B buyer costs three to five times the original acquisition. That is a $120,000 to $400,000 hole that never appears in a channel report.
Supply recruited everywhere at once. A supply team with a headcount target signs 600 providers across every category the platform lists. Nobody reaches 12 responsive providers in anything. Onboarding cost runs $90,000 to $360,000, churn inside twelve months sits between 45 and 70 percent, and the platform has a large directory and no market. This pattern recurs across platforms at seed and Series A, almost always because the supply target was a count rather than a ratio.

The category widened at the first sign of traction. One niche starts working, fill rate clears 70 percent, and the instinct is to replicate immediately across five adjacent categories. Each new category starts at zero density while the team's attention halves. The original category stalls, the new ones never start, and two quarters of compounding gets traded for a slide. The right move is to extend from a dense category into the one adjacent category that shares suppliers, and to do it once the first is self-sustaining rather than merely promising.
How to choose the starting category
The thresholds below hold across most B2B verticals, and they are specific enough to apply without a workshop.
If a category has fewer than 12 responsive providers, spend nothing on demand in it. Every dollar leaks. Fix supply or pick a different category.
If the head term carries more than 1,500 monthly searches and fewer than 40 identifiable suppliers exist in the niche, that is the category. Search demand with fragmented supply is the whole thesis of a vertical marketplace.
If the top 3 suppliers hold more than 60 percent of the category, walk away. Aggregated supply means the buyer already knows who to call, and the platform adds nothing they will pay for.
If average transaction value is under $2,000, you need 5 to 10 times the transaction volume for the same GMV, so pick a category where buyers purchase at least quarterly rather than once a year.
If the budget is under $80,000, one category only. Two categories at $40,000 each reaches density in neither and produces a flat quarter that gets the programme cut.
Two variables settle the rest: whether your supply team can reach 20 providers in that niche by name, and whether anyone internally owns the ratio between the sides rather than a count on one side.
That second variable is an org problem disguised as a metrics problem. When supply reports to one leader on a sign-up target and demand reports to another on a traffic target, both hit their numbers while the ratio between them drifts and nobody is accountable for the thing that actually determines whether the category works. The fix costs nothing: one owner, one category, one fill-rate number, reviewed weekly until it clears 70 percent. Platforms that make that change usually find the sequencing problem solves itself within a quarter.
See how this sequencing has played out on other marketplace platforms in our case studies.
Worth stating plainly, because it is the hardest part to sell internally: the right first category is frequently not the biggest one. The biggest category usually has the most aggregated supply and the most incumbent competition, which is exactly where a new platform has the least to offer. The category to win first is the one where buyers are underserved and suppliers are scattered, even when the total addressable value looks unexciting on a slide.
What the demand engine looks like once density exists
Once a category holds above 70 percent fill rate, the demand plan becomes a normal B2B growth problem, and it converts at a rate that makes the earlier patience look cheap. Buyer acquisition cost in a dense category typically runs 40 to 60 percent below the same platform's blended figure across thin categories, for the simple reason that the traffic now converts.
Content leads, because the buying question is now answerable with proof. A category page that names 20 responsive suppliers and a median response time beats a generic overview in both search and AI answers. Costing $460 to $1,040 per page, a set of 10 pages covering the decision runs $5,000 to $10,000 and holds position for 18 months or more. Amortised across a working category, the cost per 1,000 incremental organic sessions per month settles between $290 and $920 in year two, which is where the compounding argument stops being theoretical.
Paid then does a narrower job. It covers the 30 to 60 terms with transactional intent, at $3 to $8 per click inside a constrained category, and it exists to fill the pipeline while organic matures rather than to carry it. Outbound to buyers works at this stage and not before, because the claim is now checkable.
This sequencing is also why a16z has argued that AI is reopening marketplace categories that previously failed on unit economics, a thesis set out at length in the cold start problem work on atomic networks. The constraint was never demand. It was the cost of reaching density in a small enough network for the thing to work at all, and that cost has fallen.
Reporting a two-sided funnel without flattering it
A single-funnel dashboard will hide a two-sided failure for two quarters, which is usually one quarter longer than the budget survives. Blended traffic and blended conversion average a dense category together with thin ones and produce a number that means nothing operationally.
Report four things per category rather than per platform. Responsive providers, not registrations. Fill rate, the share of requests receiving three or more quotes. Request-to-transaction rate. And loaded cost per responsive supplier alongside cost per transacting buyer, so the ratio between the two sides is visible rather than inferred. A category that moves from 8 to 19 responsive providers and from 38 to 72 percent fill rate is a defensible quarter even if total GMV barely moved, because the compounding has started. The same quarter reported as blended traffic looks like a failure and gets treated as one.
If you are deciding where next quarter's growth budget goes, it is worth a conversation. Get in touch with Digica.
Concentrating a $100,000 growth budget into one category reaches a working fill rate in 4 to 7 months and typically pays back in 9 to 18 months, against 9 to 16 months to first fill and a far higher loaded supplier cost when the same money is spread across a catalogue. The cost of doing nothing is not slow growth. It is the $120,000 to $400,000 of burned buyer relationships created by opening demand into categories that cannot answer, and those buyers do not come back cheaply.
FAQ
Which side of a marketplace should you acquire first?
Almost always the supply side, and specifically the responsive supply side, inside one narrow category. The exception is a category where supply is already aggregated on a directory or an incumbent platform, in which case buying demand first gives recruitment a real request to point at.
How much does it cost to launch a B2B marketplace category?
Reaching a working fill rate in one constrained category runs $60,000 to $140,000 supply-first, against $120,000 to $300,000 demand-first and $200,000 to $450,000 funding both sides at once. The spread comes from how much of the spend happens before density exists.
What is marketplace density and how do you measure it?
Density is the point where a cold buyer gets a usable answer without intervention. Measure it as responsive providers per category at 12 or above, 24 hour response rate above 60 percent, and fill rate above 70 percent. Registered supplier counts are not a measure of density.
How narrow should a marketplace starting category be?
Narrow enough that a buyer would describe it in one phrase and your category page answers that exact phrase. If the page needs eight subcategories to cover the term, it is too wide to reach density within two quarters.
When is it safe to turn on demand spend?
When fill rate holds above 70 percent for a full month in the target category. Below that, roughly half of acquired buyers get an experience that stops them returning, and reacquiring them later costs three to five times the original acquisition.
How long does a marketplace go-to-market take to pay back?
Nine to 18 months for a platform concentrating on one category with existing product in market. Cold starts with no category dense yet typically run 18 to 30 months, which is why the category choice matters more than the channel plan.
Should a marketplace charge the supply side or the demand side?
Whichever side is less price sensitive and easier to keep, which on most B2B platforms is supply. The decision should be made deliberately at the start rather than drifting into free listings, because moving a take rate onto a side that has been subsidised for two years is close to impossible.