How to Set a B2B Marketing Budget for a Marketplace in Year One, and Split It Between Buyers and Suppliers
Most marketplace founders set their first B2B marketing budget the way a SaaS company would: a percentage of revenue, a benchmark from a survey, a round number that feels safe. In year one, that method fails. A marketplace doing $40,000 of monthly net revenue cannot anchor a growth budget on 10% of it, and a single total hides the decision that matters most: how much goes to buyers and how much to suppliers.
Spend on the wrong side and the money disappears. Buyer requests that no supplier can fill teach buyers not to come back. Suppliers recruited into categories with no demand churn before their first lead. In the marketplaces we work with, the most expensive year-one mistake is rarely the total budget. It is the split.
This guide covers how to set a year-one B2B marketing budget for a marketplace from unit economics, how to split it between buyers and suppliers using fill rate, a starting channel mix, and a worked example with the arithmetic shown. It pairs with our stage-by-stage guide to growing a B2B marketplace.
Quick Navigation
- Why percentage-of-revenue budgets fail in year one
- How to set the total: allowable acquisition cost per side
- How to split the B2B marketing budget between buyers and suppliers
- A year-one channel mix
- Concentrate budget on wedge categories
- Three failure scenarios
- Where to start: a decision framework
- A worked example: a $30,000 monthly budget
- What the right split is worth on the same budget
- FAQ
- Related Articles
Why percentage-of-revenue budgets fail in year one
Percentage-of-revenue budgets fail in year one because a young marketplace's revenue is too small and too volatile to anchor a growth plan, and because one total hides two different acquisition problems. A budget has to be built from what one buyer and one supplier are worth, then capped by runway.
Three reasons the usual benchmarks mislead:
- They come from single-sided companies. Survey benchmarks for B2B marketing spend mostly describe companies with one customer type. A marketplace has two, each with its own cost and value.
- They assume a stable revenue base. In year one, revenue can double in a quarter or stall for two. A budget tied to it swings at exactly the wrong moments.
- They ignore liquidity. A dollar spent on buyers in a category with no suppliers returns almost nothing, however efficient the channel.
The better anchor is the curve investors expect to see. a16z's marketplace metrics framework notes that, in a given market, CAC should decrease and the organic share of users should grow over time. A year-one budget should be designed to produce that curve: paid channels to learn fast, and a growing share of spend on organic foundations that keep working after the budget stops.
How to set the total: allowable acquisition cost per side
Set the total by working out how much you can afford to pay for one active buyer and one active supplier, then multiplying by the number of each you need. Allowable cost per side is the net revenue that customer generates over your payback window.
The calculation, per side:
- Net revenue per transaction. Average transaction value times take rate.
- Transactions in the payback window. How many times an active buyer or supplier transacts in 12 months, from your own cohort data.
- Allowable acquisition cost. Net revenue per transaction times transactions in the window. That is the ceiling, not the target.
- Target cost. In year one, aim for half the ceiling, so each cohort pays back in about six months.
Then cap the total by runway. If you have 18 months of runway, a budget whose cohorts pay back in six months is defensible. If you have nine, only channels that pay back in under six months belong in the plan.
One caution: a transaction needs both a buyer and a supplier, so the two ceilings overlap. Treat each side's ceiling as an upper bound, and judge the plan on total net revenue against total spend.
Do you know your allowable cost per side?
Our growth audit calculates acquisition ceilings for buyers and suppliers from your real cohorts.
If you lack cohort data, use your first 90 days of transactions and say so in the plan. A rough number that the team updates monthly is more useful than a benchmark borrowed from a company that does not look like yours. Write the assumptions on one page: transaction value, take rate, transactions per year by side and target payback. When the board asks why the budget is $30,000 and not $50,000, that page is the answer, and every quarter it gets more accurate.
How to split the B2B marketing budget between buyers and suppliers
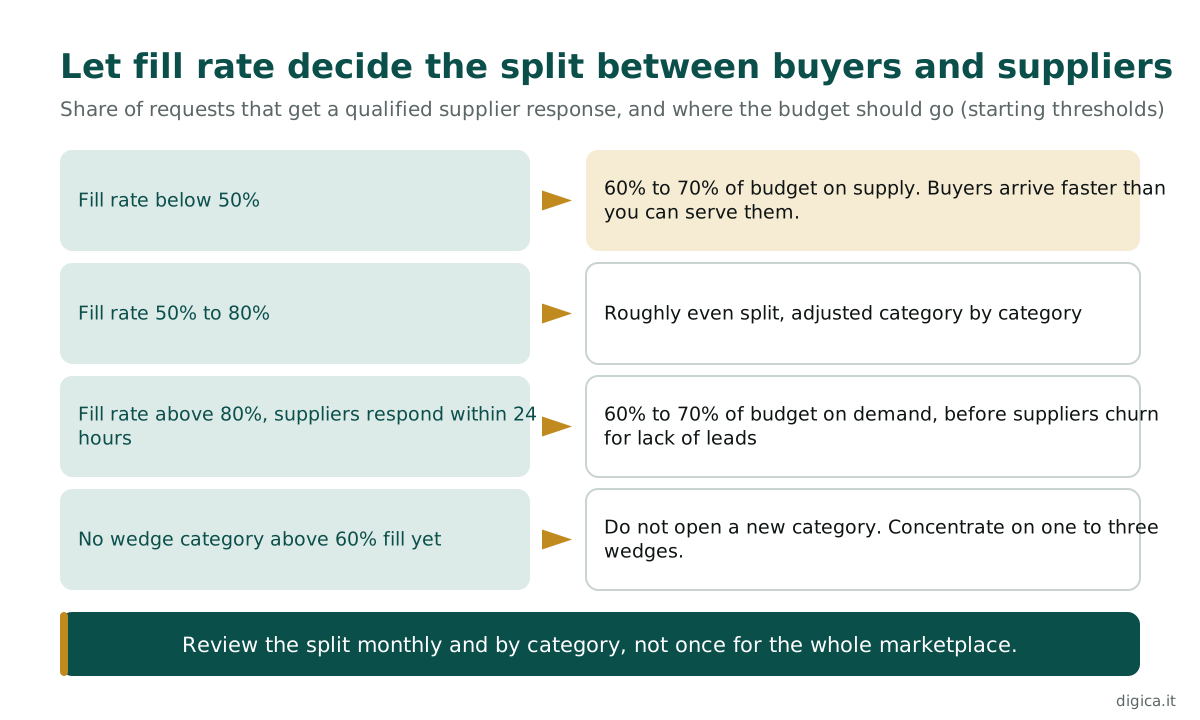
Split the budget by fill rate: the share of buyer requests that get a qualified supplier response. When fill rate is low, supply is the constraint and most of the budget should go to suppliers. When fill rate is high, demand is the constraint and the budget should shift to buyers.
Starting thresholds from our engagements:
- Fill rate below 50%: 60% to 70% of budget on supply. Buyers are arriving faster than you can serve them.
- Fill rate 50% to 80%: roughly even split, adjusted category by category.
- Fill rate above 80%, with suppliers responding within 24 hours: 60% to 70% on demand. Suppliers will churn if leads do not arrive.
Review the split monthly, and by category rather than across the whole marketplace. A marketplace can be supply-constrained in one category and demand-constrained in the next, and a single global split will overfund one and starve the other.
Supply acquisition usually looks more expensive per head, and that is fine. In most B2B marketplaces we work with, an active supplier costs three to five times as much to acquire as an active buyer, and generates several times more transactions over a year. Comparing the two on cost per signup is the fastest way to underfund the side that limits growth. Our guide to attracting vendors to a B2B marketplace covers the supply channels in detail.
A year-one channel mix
A sensible year-one channel mix puts the largest share into organic foundations that compound, a large share into direct supply acquisition, a smaller share into paid tests, and a fixed slice into measurement. The starting allocation we use with marketplaces is 40%, 30%, 20% and 10%.
Organic foundations (about 40%). Category pages built as money pages, search and AI visibility, and earned editorial coverage on domains your buyers and suppliers already read. This is slow in month one and the cheapest source of requests by month twelve. It is also the part of the budget that keeps producing after spend stops, which is why it should start first. It is the work we build at Digica, and the reason we push it early.
Direct supply acquisition (about 30%). Outbound to suppliers in the wedge categories, partnerships with associations and software vendors that serve them, and onboarding support until the first lead arrives.
Paid tests (about 20%). Small, time-boxed tests on search, social and sponsorships to learn which messages and audiences convert. Kill fast, scale only what beats the allowable cost.
Measurement and tools (about 10%). Tracking for both funnels, a CRM that separates buyers from suppliers, and the reporting that tells you when to change the split.
Year-one channel options compared by cost share, payback, main risk and best fit (starting allocation from our engagements).
| Channel bucket | Cost share of budget | Typical payback | Main risk | Best for |
|---|---|---|---|---|
| Organic foundations (SEO, GEO, earned coverage) | About 40% | 6 to 12 months, then compounding | Slow start, needs patience | Every marketplace with a category to own |
| Direct supply acquisition | About 30% | 3 to 9 months per active supplier | Recruiting suppliers into empty demand | Supply-constrained categories |
| Paid tests | About 20% | Immediate, stops when spend stops | Renting demand you never own | Learning messages and audiences fast |
| Measurement and tools | About 10% | Indirect | Dashboards nobody uses | Knowing when to change the split |
The mix moves with fill rate. When supply is the constraint, direct supply acquisition can take 40% to 50%. When demand is, paid tests and organic take more.
Concentrate budget on wedge categories
Concentrate year-one budget on one to three wedge categories until each reaches healthy fill rates. Spreading the same budget across every category the platform could serve buys a little traffic everywhere and liquidity nowhere.
A wedge category is narrow enough to fill and valuable enough to matter: a specific service, a specific geography, a specific buyer type. Benjamin Edelman's HBR guide to launching platforms makes the underlying point that a strong launch usually requires convincing early users to join even before the platform reaches scale. In practice, that is far easier in one category than in twenty.
How to pick the wedges:
- Demand you can see. Search volume, inbound requests or a partner channel that already reaches buyers.
- Supply you can reach. A list of 100 to 300 suppliers you can contact directly, through associations or directories.
- Transactions that repeat. Categories where buyers come back within the year pay back faster.
Our breakdown of two-sided go-to-market covers wedge selection in more depth. Expand to the next category only when the current wedges fill at least 60% of requests.
Which categories should get your first dollar?
We will pick your wedge categories with you from your own demand and supply data.
Concentration also makes the budget easier to defend. A board can see 70% fill in two categories and understand the plan. It cannot see 20% fill across twenty and believe the next dollar will change anything. It also makes the marketing sharper: one category means one supplier list to work, one set of buyer questions to answer on category pages, and one message that can be tested and improved every week instead of diluted across every audience at once.
Three failure scenarios
These patterns recur in year-one marketplaces we work with. Figures are representative, not a specific account.
Scenario 1: all budget to demand. A B2B services marketplace spends $20,000 a month on buyer acquisition while fill rate sits at 35%. About 65% of requests go unfilled, so roughly $13,000 a month buys requests nobody answers. Buyers who get no response rarely return.
The right call: shift to 60% to 70% supply until fill rate passes 50%, then rebalance.
Scenario 2: twenty categories, no liquidity. An industrial marketplace launches with 25 categories and spreads $25,000 a month across all of them. After six months, no category fills more than 30% of requests, and the team cannot tell which ones would work with focus.
The right call: pick three wedge categories, put 80% of the budget there, and expand only after each fills 60%.
Scenario 3: all paid, nothing compounding. A marketplace puts 90% of its budget into paid search and social. Requests look healthy until a cash squeeze forces a 50% budget cut. Requests fall by almost as much within a month, because organic channels were never built.
The right call: hold organic foundations at about 40% from the start, even when paid looks cheaper per request in the first quarter.
The thread through all three is that the total budget was not the problem. The allocation was.
Where to start: a decision framework
Use fill rate, runway and channel mix to set and adjust the budget. These thresholds come from our own engagements; adapt them to your margins.
- If fill rate is below 50%, put 60% to 70% of the budget on supply in that category.
- If fill rate is 50% to 80%, split roughly evenly and review monthly by category.
- If fill rate is above 80% and suppliers respond within 24 hours, put 60% to 70% on demand.
- If runway is under 12 months, fund only channels whose cohorts pay back within six months.
- If paid channels still drive more than 70% of requests after six months, move 10 points of budget a quarter into organic foundations.
- If no wedge category fills 60% of requests yet, do not open a new category.
The pricing of each side matters too. Your marketing budget is part of how you subsidize one side of the market: money spent recruiting suppliers for free is a price you pay so buyers find a full market. Treat it that way in the plan, next to any fee discounts you give either side.
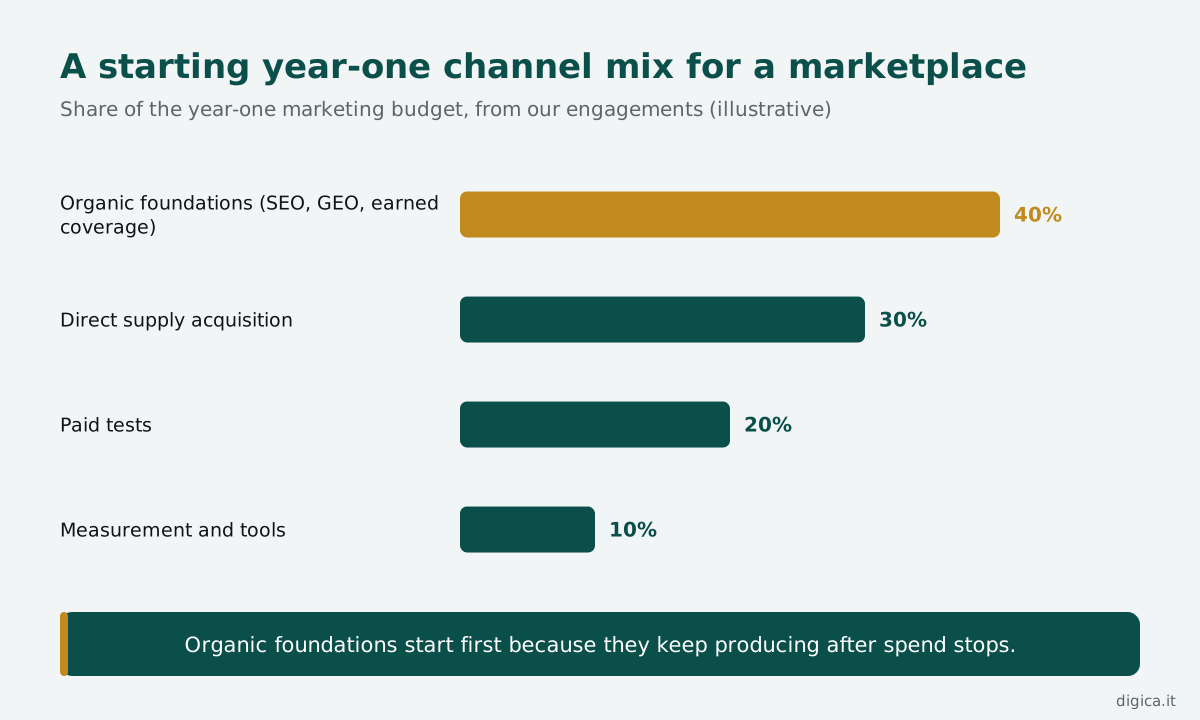
Treat the mix in the chart as the opening position, not the plan for the whole year. By the end of the second quarter, your own cost per active buyer and supplier should be replacing every assumption in it.
A worked example: a $30,000 monthly budget
Build the budget from unit economics. Take a B2B services marketplace (illustrative numbers):
- Net revenue per transaction: $200
- Active buyer: 3 transactions in the first year, so $600 of net revenue
- Active supplier: 12 transactions in the first year, so $2,400
- Allowable cost on a 12-month payback: $600 per active buyer, $2,400 per active supplier
- Target cost at half the ceiling: $300 per active buyer, $1,200 per active supplier
The marketplace is supply-constrained (fill rate 45%), so it targets 15 new active suppliers and 40 new active buyers a month:
- Supply: 15 × $1,200 = $18,000 (60% of budget)
- Demand: 40 × $300 = $12,000 (40% of budget)
- Total: $30,000 a month, or $360,000 in year one
Each side pays back in about six months: $300 against $600 of first-year value for buyers, and $1,200 against $2,400 for suppliers. Because every transaction needs both sides, the real payback sits between the two and depends on matches, which is why fill rate is the number to watch every week.
Test the model before you commit to it. If an active supplier really costs $1,800 rather than $1,200, the same 15 suppliers need $27,000 a month and the plan no longer fits inside $30,000. The fix is not to cut suppliers; it is to narrow to fewer wedge categories, where outreach lists are shorter and conversion is higher. If an active buyer costs $450 instead of $300, buyer payback stretches to nine months, which is still acceptable with 18 months of runway and too slow with nine.
The same model tells you when to raise the budget. Once fill rate passes 60% in the wedge categories and both sides pay back inside six months, every extra dollar has a known return. That is the moment to go back to the board with a larger number, and the cohort data to justify it.
Want this model built on your numbers?
Our growth audit turns your cohorts into a year-one budget and split you can defend.
Now run the same $30,000 with the split reversed: $18,000 on buyers and $12,000 on suppliers. That buys 60 buyers and 10 suppliers a month. With fill rate already at 45%, most of the extra buyer requests go unanswered, so the extra buyer spend returns little until supply catches up. The total did not change. The outcome did. Worse, the unanswered buyers do not wait: in our experience, a buyer whose first request goes unfilled is far less likely to send a second, so the reversed split also shrinks the demand you will have once supply arrives.
What the right split is worth on the same budget
On the same budget, the right split is worth the transactions that the wrong split leaves unfilled. In the example, a supply-heavy split on a $30,000 monthly budget pays back in about six months on each side. Reversing it in a 45% fill-rate market wastes most of the extra $6,000 of buyer spend each month, roughly $72,000 a year, on requests nobody serves.
Deciding which side to subsidize is one of the oldest questions in platform strategy; the HBR article on strategies for two-sided markets is still the standard framing. A marketing budget split is that same decision, made every month. The cost of doing nothing is a budget that looks reasonable in total and quietly buys the wrong side. That shows up as a falling fill rate, buyers who stop coming back, and a growth curve that is hard to explain in the next fundraise.
The number to take into your next leadership meeting: at a 45% fill rate, a 60/40 split toward supply on $30,000 a month pays back in about six months, and the reverse split wastes about $72,000 a year.
FAQ
How much should a B2B marketplace spend on marketing in year one? Set the budget from allowable acquisition cost per side, not from a percentage of revenue. Work out the net revenue an active buyer and an active supplier generate over 12 months, target half of that as your acquisition cost, multiply by the cohorts you need, and cap the total by runway.
How do you split a marketing budget between buyers and suppliers? Use fill rate, the share of requests that get a qualified supplier response. Below 50%, put 60% to 70% on supply. Between 50% and 80%, split roughly evenly. Above 80% with fast supplier responses, put 60% to 70% on demand. Review monthly by category.
What percentage of a startup's budget should go to marketing? There is no reliable benchmark for marketplaces, because survey figures mostly describe single-sided companies. A better test is payback: fund channels whose cohorts pay back within your runway, ideally within six months in year one.
Should a marketplace spend on paid ads in year one? Yes, for learning, not as the main engine. We start with about 20% of budget on time-boxed paid tests. Paid requests stop when spend stops, so organic foundations should take about 40% from the start.
What is a wedge category? A wedge category is a narrow segment of the market, such as one service, one geography or one buyer type, where a marketplace can reach healthy fill rates fast. Concentrating year-one budget on one to three wedges builds liquidity that a budget spread across every category cannot.
How often should a marketplace review its marketing budget? Review the split between buyers and suppliers monthly, by category, and the total budget quarterly against runway and payback. Fill rate is the weekly signal that tells you when to move money.
Related Articles
- How to grow a B2B marketplace: a stage-by-stage guide
- How to attract vendors to a B2B marketplace (and keep them)
- Paid vs organic marketplace growth: a founder lesson
- Fractional CMO cost vs a growth consultant vs an agency
Where this connects
This article is part of our B2B marketplace growth series.