The best alternative data providers for investors in 2026, compared head to head
Alternative data providers now sell to almost every investment firm. In Lowenstein Sandler's latest survey of investment managers (Lowenstein Sandler), 90% said they use alternative data, up from 67% a year earlier, and 89% plan to raise their alternative data budgets in 2026. The question for a fund is no longer whether to buy, but which provider fits the way it invests.
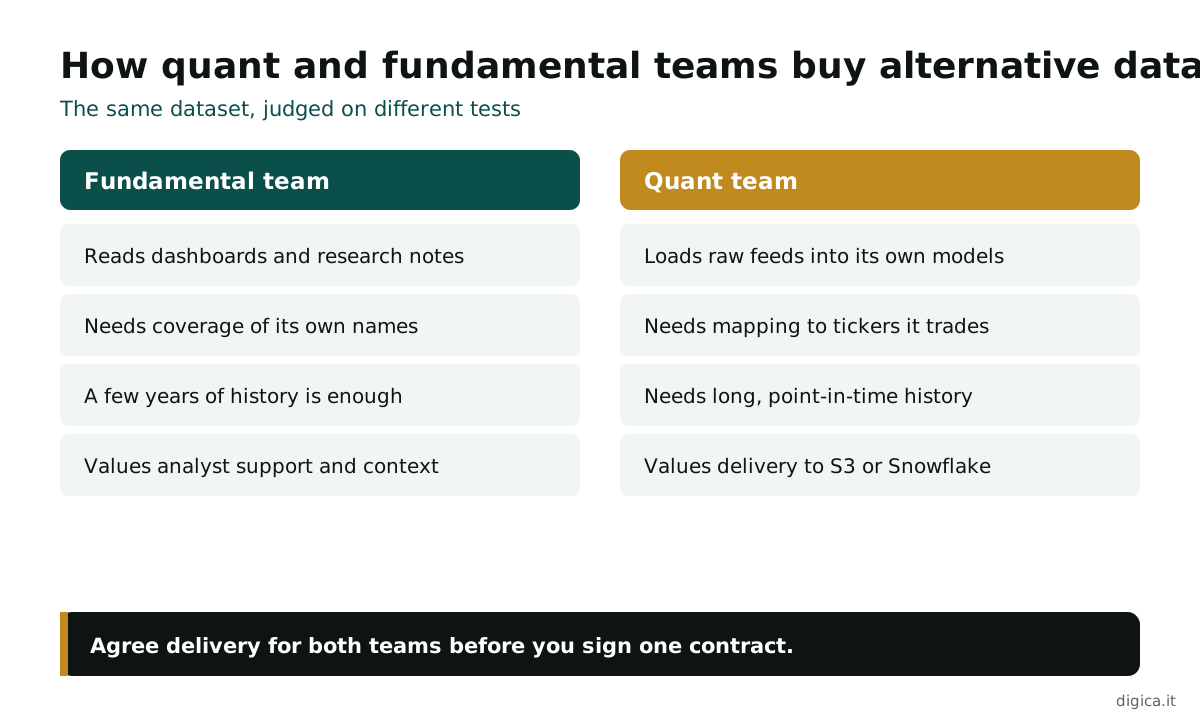
That is harder than it looks. A card panel that suits a fundamental analyst reading a dashboard can be useless to a quant team that needs ten years of point-in-time history in Snowflake. The same dataset can win one buyer and lose another on delivery alone.
This guide compares seven of the best alternative data providers for investors head to head, on the data types they sell, the coverage they claim, the history you can backtest and how they deliver it. Figures are each provider's own, checked on October 26, 2026. If you are looking for places that sell many datasets at once, see our ranking of data marketplaces.
Quick Navigation
- What alternative data means for investors
- The scorecard: seven alternative data providers
- Card and receipt data: Consumer Edge against Bloomberg Second Measure
- Multi-source research feeds: YipitData against M Science
- Digital and physical traffic: Similarweb against Placer.ai
- The specialist pick for news and sentiment: RavenPack
- Delivery and backtesting: what quants should ask
- Three failure scenarios
- Which alternative data provider fits your fund
- FAQ
- Related Articles
What alternative data means for investors
The short answer: alternative data is any information about a company's performance that does not come from the company itself, its filings or its analysts, such as card transactions, receipts, web and app traffic, foot traffic, job postings and news sentiment.
Investors buy it for one reason: to see a trend before it shows up in reported numbers. A card panel can show a retailer's sales slowing weeks before the quarter closes. Web traffic can show a software company losing visitors. Job postings can show where a company is hiring, and where it has stopped.
The market has grown up. The leading alternative data providers now publish their coverage in tickers or brands and offer delivery straight into a data warehouse. What separates them is less the raw data and more what they do with it: how they map transactions to tickers, how long their history runs and whether that history is point-in-time, meaning it shows only what was known on each date.
Coverage claims use different units, which makes them hard to compare. One provider counts tickers, another counts brands or merchants, a third counts devices or accounts in its panel. A panel of 180 million accounts and a feed covering 1,400 companies are both large, but they answer different questions, so the useful comparison is always the overlap with the names you actually cover.
Our view: buy alternative data the way you would hire an analyst. Start with the question you need answered, then find the provider whose data, history and delivery answer it, rather than buying the biggest panel and looking for a use.
The scorecard: seven alternative data providers
The short answer: YipitData and M Science sell the broadest multi-source research, Consumer Edge and Bloomberg Second Measure lead on card data, Similarweb and Placer.ai on digital and physical traffic, and RavenPack on news sentiment with the longest stated history.
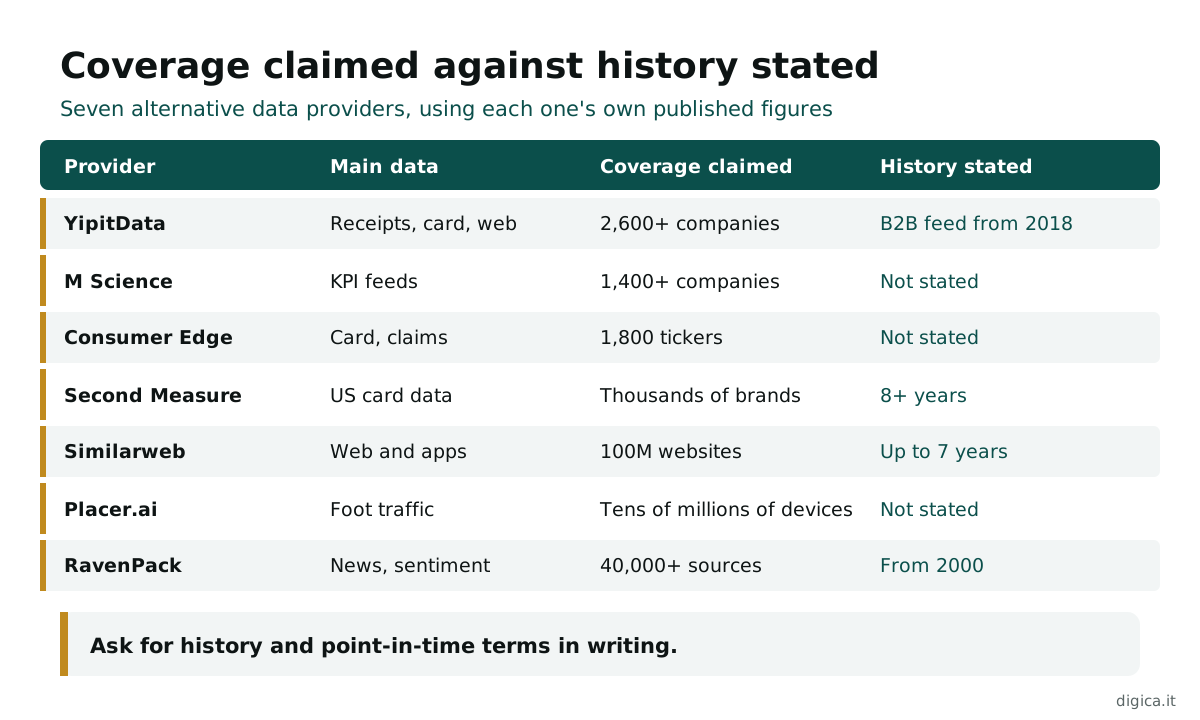
Seven alternative data providers compared on data type, claimed coverage, stated history, delivery, main risk and best fit
| Provider | Main data types | Coverage claimed | History stated | Delivery | Main risk | Best for |
|---|---|---|---|---|---|---|
| YipitData | Receipts, card, web, app and B2B spend | 2,600+ public companies, 11 sectors | B2B spend feed back to 2018 | Files, dashboards, API, MCP | Premium research pricing | Funds wanting data plus analysis |
| M Science | KPI and company data feeds | 500+ feeds, 1,400+ companies | Not stated | API, S3, Snowflake, Delta Share, MCP | History must be checked per feed | Teams wanting KPI-level feeds |
| Consumer Edge | Card transactions, medical claims | 180M accounts, 1,800 tickers, 40K brands | Not stated | Not stated publicly | Panel bias by card type | Consumer and retail coverage |
| Bloomberg Second Measure | Card transactions | Billions of US purchases | 8+ years | Bloomberg Terminal and feeds | US consumers only | Terminal users tracking US brands |
| Similarweb | Web and app traffic | 100M websites, 4.7M apps | Up to 7 years | Dashboards, API, S3, Snowflake | Traffic is not revenue | Digital and software names |
| Placer.ai | Foot traffic | Panel of tens of millions of devices | Not stated | Dashboard, API, data marketplace | Mostly physical retail and real estate | Retail, REITs and lenders |
| RavenPack | News and sentiment analytics | 40,000+ web and social sources | From 2000, point-in-time | Bigdata.com platform and API | Signals need modeling work | Quant and event-driven funds |
Selling alternative data to investment firms?
In 30 minutes we look at how funds compare alternative data providers like yours, on Google and in AI answers, and where you lose them before a trial.
Read the history column first if you run systematic strategies. A provider that does not publish its history length is not necessarily short on history, but you should ask before you sign, and ask whether it is point-in-time. Where a cell says not stated, the provider does not publish that figure on its main pages. Treat it as a question for the first sales call, not as a reason to rule the provider out.
Card and receipt data: Consumer Edge against Bloomberg Second Measure
The short answer: Consumer Edge covers more tickers and adds health claims data, while Bloomberg Second Measure is the easier choice for funds that already live in the Bloomberg Terminal and track US consumer brands.
Consumer Edge claims transaction data from 180 million accounts, covering 1,800 tickers and 40,000 brands and merchants, with history across five continents. It also sells enriched medical claims data. In April 2025 it acquired Earnest Analytics, another card and consumer data provider, which brought two of the larger panels under one roof.
Bloomberg Second Measure analyzes billions of purchases made by millions of US consumers, across thousands of public and private companies and brands. It states more than eight years of history and data available two, three or seven days after the card swipe. Bloomberg bought it in 2020, and its data sits inside the Bloomberg Terminal as well as in aggregated and transaction-level feeds.
The head-to-head comes down to reach against convenience. Consumer Edge has broader stated coverage and more data types. Second Measure has a stated history length, a short lag and no extra platform to learn. A fund covering global consumer names will lean toward Consumer Edge. A US-focused analyst team on the Terminal will get to an answer faster with Second Measure.
Head-to-head pick. Consumer Edge for breadth, Bloomberg Second Measure for speed to insight inside the Terminal.
Multi-source research feeds: YipitData against M Science
The short answer: YipitData sells the broadest mix of sources with its own analysis on top, while M Science, owned by Jefferies, sells company and KPI-level feeds with unusually flexible delivery.
YipitData builds panels from email receipts, in-store receipts, card transactions, web-scraped product data, app downloads, web traffic, ad spend and business software spend. It covers 2,600+ public companies across 11 sectors and says it serves 650+ customers. Its business spend feed tracks $740 billion in annual spend across 2,600+ global tickers, with history back to 2018, and it describes its quant data as deep, point-in-time history built for backtesting. It delivers through files, dashboards, a research API and, newer, AI agents and MCP connections.
M Science is a Jefferies subsidiary that sells 500+ data feeds tracking 1,400+ companies across 40 subsectors, including private companies. It delivers through APIs, Amazon S3, Snowflake, Delta Share or MCP, on a unified data model, and pairs its feeds with research reports. It does not publish a history length on its main pages.
Both sell analysis as well as data, and that is the real choice. YipitData leads with the number of sources behind each company estimate. M Science leads with KPI-level feeds a quant team can load straight into its own models.
Head-to-head pick. YipitData for the widest source mix with research attached, M Science for feed-first teams that want delivery on their own terms.
Digital and physical traffic: Similarweb against Placer.ai
The short answer: Similarweb tracks websites and apps, which suits software, ecommerce and internet names, while Placer.ai tracks foot traffic to physical locations, which suits retail, restaurants, real estate and lenders.
Similarweb sells investor data on 100 million websites and 4.7 million apps across 190 countries, plus SKU-level and transaction signals. Data arrives with a 48 to 72 hour lag in daily, weekly or monthly views. Its API offers up to seven years of history depending on plan, and quant teams can take delivery through the API, Amazon S3 or Snowflake.
Placer.ai measures foot traffic from a panel of tens of millions of devices, refreshed daily. It says hundreds of investors and lenders use it, and offers a dashboard, an API for aggregated data and a data marketplace. It does not publish its history length on its finance page.
The two answer different questions. Similarweb shows whether people are visiting and using a digital product. Placer.ai shows whether they are walking into a store, mall or office. Neither is revenue, so both work best alongside transaction data.
Head-to-head pick. Similarweb for digital businesses, Placer.ai for physical ones.
The specialist pick for news and sentiment: RavenPack
The short answer: RavenPack turns news, filings and social media into structured, point-in-time sentiment and event data, with history back to 2000, the longest stated in this ranking.
RavenPack analyzes content from more than 40,000 web and social media sources, covering news, job data, filings and transcripts. Its records are point-in-time, with sentiment and media attention scores, and its editions on the Wharton Research Data Services platform start in 2000, according to the Wharton Research Data Services listing. That depth is why it suits quant and event-driven funds that need to test a signal across several market cycles.
In December 2025 FT Ventures, the venture arm of the Financial Times, made a strategic investment in RavenPack, paired with a deal to license FT content into its Bigdata.com platform. That gives its newer research product a premium news source alongside the web.
News data has a different weakness from card or traffic data. It does not measure sales at all; it measures what is being said and how fast it spreads. That makes it strongest around events such as earnings, guidance changes, lawsuits and management departures, and weakest as a slow read on demand. Most systematic funds that use it combine it with a transaction or traffic dataset rather than relying on it alone.
Why it is here. The strongest choice for systematic investors who need long, point-in-time history on news and events.
Delivery and backtesting: what quants should ask
The short answer: before buying, ask for the history length, whether it is point-in-time, how entities map to tickers and how the data reaches your warehouse.
Delivery has moved toward the cloud. M Science, Similarweb and YipitData all name warehouse or bucket delivery, and several now offer MCP connections for AI tools. The buyers want it: Crisil Coalition Greenwich surveyed 56 buy-side firms in late 2025 and found that 75% have built alternative data into their research and investment process, 46% use it in portfolio construction and 63% plan to increase spend (Crisil Coalition Greenwich).
- History length. How many years, and does it cover at least one downturn?
- Point-in-time. Does the history show what was known on each date, or has it been restated with later data?
- Ticker mapping. How are brands and merchants mapped to listed companies, and how are changes handled?
- Panel changes. How has the panel grown or shifted, and is that adjusted for?
- Lag. How many days after the event does data arrive?
- Delivery. API, S3, Snowflake or Terminal, and in what format?
Do investment firms find your data when they search?
A growth audit maps how funds search for alternative data, on Google and in AI answers, and which of your coverage and backtesting pages they never reach.
Our view: a panel that cannot answer the point-in-time question in writing should not go into a systematic model. It may still be useful to a fundamental analyst, who reads it as context rather than as a signal. Run every trial on 20 tickers you already know well, where you can tell a real turn in the data from noise, and agree the trial length and the success test in writing before the data arrives.
Three failure scenarios
These are the patterns that recur when funds buy alternative data on headline coverage alone.
- The backtest that saw the future. A quant team tests a card-data signal on five years of history and finds a strong result. Live, it fades. The history had been restated as the panel grew, so the test used information that was not available at the time. Asking for point-in-time data before the trial would have exposed it.
- The dashboard the quants could not use. A multi-strategy fund buys an enterprise license for a dashboard-led product. The fundamental team uses it daily. The quant team needs raw history in Snowflake, which costs extra and takes months to arrange. Agreeing delivery for both teams up front would have saved a second negotiation.
- The dataset with an unclear source. A fund buys app usage data from a small vendor without checking how it was collected. The vendor turns out to have used data in ways it had told its own users it would not. Due diligence on sourcing and consent, documented before the purchase, would have protected the fund.
That third case is not hypothetical. The US Securities and Exchange Commission charged App Annie, an app data provider, with securities fraud in 2021 for misrepresenting how its data was derived, in what it called its first enforcement action against an alternative data provider (SEC). App Annie agreed to pay a $10 million penalty and its co-founder $300,000.
Which alternative data provider fits your fund
The short answer: choose by strategy first, then by the sector you cover, then by delivery.
- If you run systematic strategies and need ten years or more of point-in-time history, start with RavenPack for news and events, and ask every other provider for written history and point-in-time terms.
- If you cover US consumer brands from the Bloomberg Terminal, trial Bloomberg Second Measure first.
- If you cover consumer and retail names globally, compare Consumer Edge and YipitData on the same 20 tickers.
- If you want feeds loaded into your own models with flexible delivery, trial M Science.
- If you cover software, ecommerce or internet companies, add Similarweb.
- If you cover retail property, restaurants or lenders exposed to physical stores, add Placer.ai.
Running a data B2B marketplace or alternative data platform?
We help data B2B marketplaces recruit the data providers that make a catalog worth searching, and reach the investment teams comparing them.
The number to take into your next investment committee is the trial cost of choosing wrong. A dataset that fails a point-in-time check wastes the months a team spends testing it, and a live signal built on restated history can lose money before anyone notices. If you test history, mapping and delivery on 20 tickers you already know before you sign, you find most of those problems in a week. Skipping the sourcing check costs more: App Annie's $10 million penalty shows what a data provider's shortcuts can lead to, and the fund that relied on the data still has to explain it. The biggest cost of doing nothing is a budget that rises every year, as 89% of managers plan, without a clear test of what each dataset adds.
FAQ
What are alternative data providers? Alternative data providers sell information about companies that does not come from filings or analysts, such as card transactions, receipts, web and app traffic, foot traffic, job postings and news sentiment. Investors use it to see trends before they appear in reported results.
Who are the best alternative data providers in 2026? Strong choices in 2026 include YipitData and M Science for multi-source research feeds, Consumer Edge and Bloomberg Second Measure for card data, Similarweb for web and app traffic, Placer.ai for foot traffic and RavenPack for news sentiment.
How do hedge funds use alternative data? Hedge funds use alternative data to estimate company results before they are reported, to spot changes in demand, and to build systematic signals. Fundamental teams read it in dashboards, while quant teams load long, point-in-time history into their own models.
What is point-in-time data? Point-in-time data shows only what was known on each date, without later corrections or panel changes. It is essential for backtesting, because restated history can make a signal look stronger than it would have been in real time.
How many investment firms use alternative data? Lowenstein Sandler's latest survey found 90% of investment managers use alternative data, up from 67% a year earlier. Crisil Coalition Greenwich found 75% of buy-side firms have built it into their research and investment process.
Is using alternative data legal? Yes, when the data was collected lawfully and does not contain material non-public information obtained in breach of a duty. Funds should check how each dataset was sourced and consented, because regulators have acted against providers that misrepresented their data.
Which alternative data provider has the longest history? Among the seven here, RavenPack states the longest history, with news analytics back to 2000. Bloomberg Second Measure states more than eight years of card data and Similarweb up to seven years of web data.
Related Articles
- Data marketplace growth
- Best data marketplaces in 2026: 10 platforms compared
- Best B2B data providers in 2026: data brokers compared
- Best expert networks for investors and consultants
- Best places to sell data in 2026: brokers and platforms
Where this connects
This article is part of our B2B marketplace growth series. Browse more on the Digica blog.