B2B ecommerce statistics 2026: market size and growth, graded by source
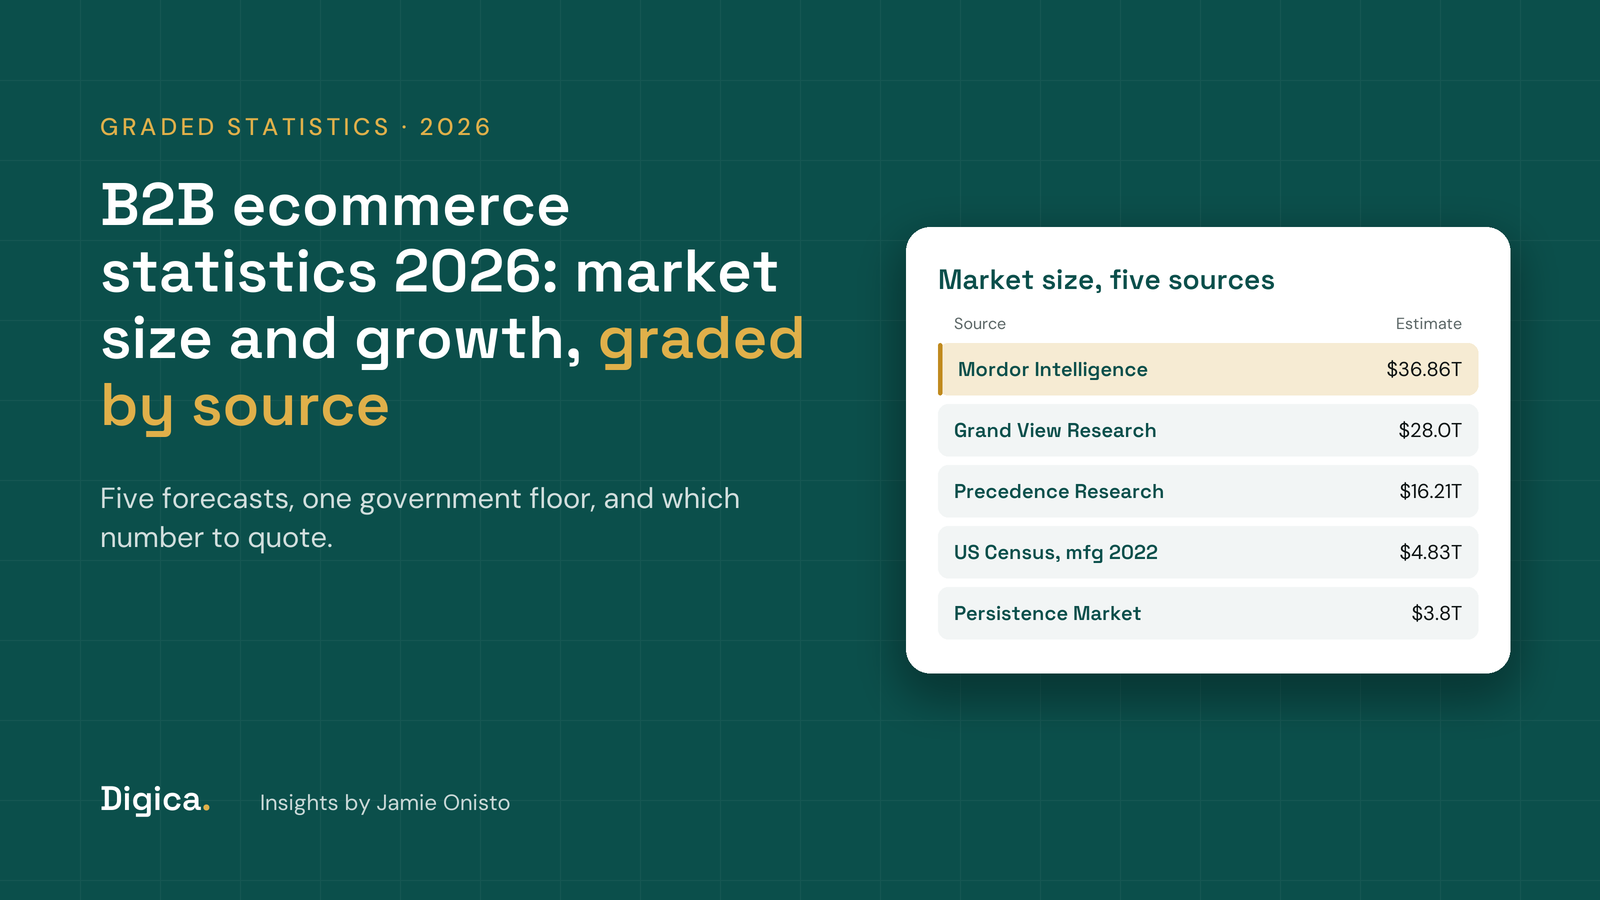
B2B ecommerce statistics disagree by a factor of almost ten. Five research firms put the 2026 global B2B ecommerce market at anywhere from $3.8 trillion to $36.86 trillion, and every one of those numbers is quoted somewhere as "the" market size. If you are writing a pitch deck, a board paper or a news story, the number you pick decides whether your claim survives the first sharp question.
The gap is not noise. It comes from what each source counts: whether orders placed over electronic data interchange (EDI) are included, whether the figure covers one country or the world, and whether it measures goods ordered online or the revenue of the platforms that take the orders. Once you know which question a statistic answers, most of the disagreement disappears.
This guide grades every B2B ecommerce statistic we could trace to its original publisher, keeps B2B marketplace figures apart from general B2B ecommerce, and reconciles the conflicting market size forecasts. It is written for founders, investors and journalists who need a number they can defend, and for operators growing a B2B marketplace. Every figure was checked on its source page on November 10, 2026.
Quick Navigation
- The headline B2B ecommerce statistics, graded
- B2B ecommerce market size: why forecasts disagree by trillions
- What the US government actually measured
- B2B ecommerce growth in the US in 2025
- B2B marketplace statistics, kept separate
- How B2B buyers behave online
- Statistics to stop quoting
- What 62 B2B marketplace rankings taught us
- Three ways a good statistic goes wrong
- Which number to use, and when
- What the B2B ecommerce market is worth to a marketplace
- FAQ
- Related Articles
The headline B2B ecommerce statistics, graded
The most defensible single number is a US government one: $4.83 trillion of manufacturing e-shipments in 2022. The most useful global number is Mordor Intelligence's $36.86 trillion for 2026, because it states what it counts. Everything else needs a qualifier.
We graded each statistic on its source, not on how often it is quoted. Grade A is government data or a company's own disclosure. Grade B is a named research firm or survey with a disclosed scope or sample. Grade C is a figure whose method or attribution is not stated on the page. A figure we could only find second-hand, in someone else's roundup, does not appear here at all.
B2B ecommerce statistics compared on figure, year, scope, grade, main risk and best use
| Statistic | Figure | Year | Scope | Grade | Main risk | Best for |
|---|---|---|---|---|---|---|
| US manufacturing e-shipments (Census) | $4,825.9 billion | 2022 | US, includes EDI | A | Four years old | A floor nobody can dispute |
| US merchant wholesale e-commerce (Census) | $3,760.2 billion | 2022 | US, includes EDI | A, with caution | 40.4% response rate | Wholesale context, never added to manufacturing |
| Global B2B ecommerce GMV (Mordor Intelligence) | $36.86 trillion | 2026 | Global, includes EDI and marketplaces | B | Asia-Pacific holds 69.1% | The global headline |
| US B2B ecommerce (Digital Commerce 360) | $2.93 trillion, up 13% | 2025 | US, digital channels | B | Method not public | Growth against a flat market |
| Amazon Business annualized gross sales | $60 billion | 2026 | One marketplace, 11 countries | A | Company metric, unaudited | Proof of marketplace scale |
| Marketplace share of online B2B order value (Mordor) | 67.02% | 2026 | Global | B | Depends on Mordor's definition | Why marketplaces matter |
| Global B2B ecommerce (Grand View Research) | $28.0 trillion | 2026 | Global, scope not stated | C | Method not disclosed | Only alongside other sources |
| Global B2B ecommerce (Persistence Market Research) | $3.8 trillion | 2026 | Global, segmented by marketplace model | C | Far below one US sector | Rarely, with a note |
Read the "Main risk" column before you quote anything. A grade A number can still be the wrong number for your sentence, and the Census wholesale figure comes with a published warning from Census itself.
B2B ecommerce market size: why forecasts disagree by trillions
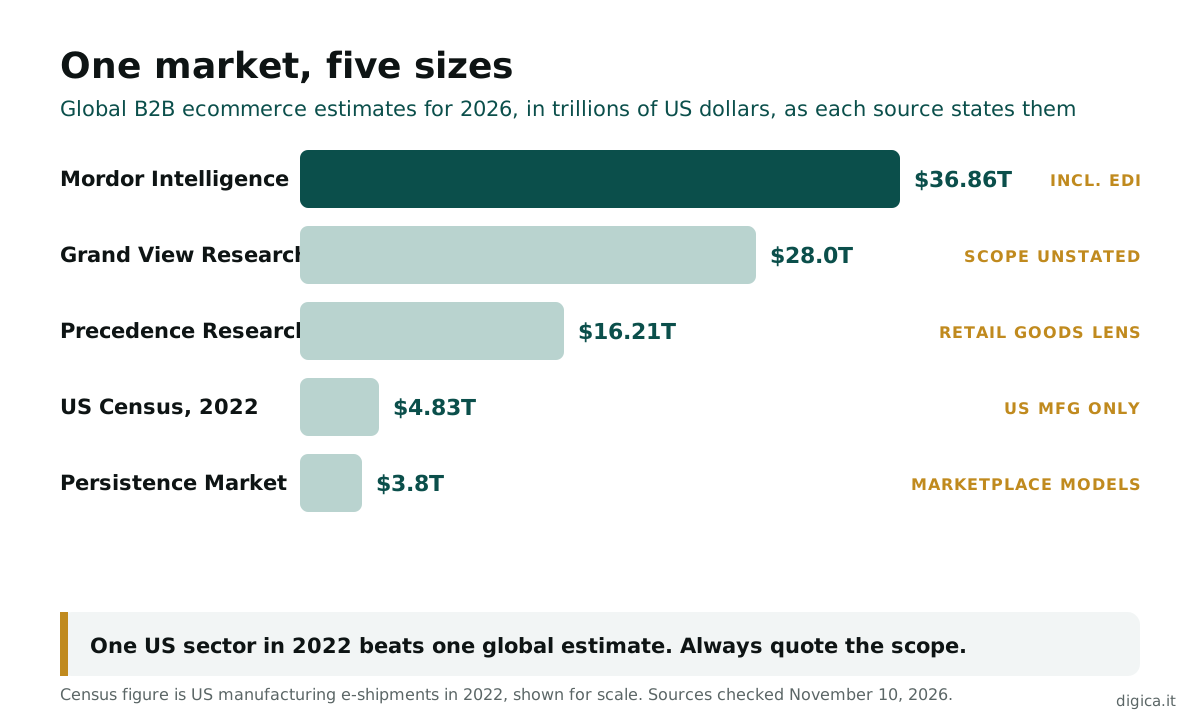
The B2B ecommerce market size depends on what you decide counts as ecommerce. Firms that include EDI land in the tens of trillions. Firms that exclude it, or that measure something narrower, land in single trillions. Neither is wrong, but they are not measuring the same market.
Here is what each firm states on its own page, checked on November 10, 2026:
- Mordor Intelligence: $36.86 trillion in 2026, rising to $40.86 trillion in 2027 and $67.56 trillion by 2032, a 10.58% compound annual growth rate (CAGR). It measures the gross merchandise value of goods and services one business orders online from another, including webstores, EDI and API portals and third-party marketplaces.
- Grand View Research: $24.1 trillion in 2025 and $28.0 trillion in 2026, growing to $105.9 trillion by 2033 at a 20.9% CAGR. The free page does not say whether EDI is included.
- Precedence Research: $16.21 trillion in 2026, reaching $68.63 trillion by 2035 at 17.50%. Its segments include home and kitchen and consumer electronics, which suggests a retail-goods lens.
- Persistence Market Research: $3.8 trillion in 2026, reaching $12.1 trillion by 2033 at 18.0%. It segments by supplier-, buyer- and intermediary-oriented models.
Four things explain the spread. EDI is the biggest: Forrester's 2022 forecast tracked EDI as a separate 20% of US B2B sales, outside its ecommerce figure, while Mordor and the US Census Bureau count it in. Geography is second: Mordor gives Asia-Pacific 69.1% of the market, which means Chinese wholesale platforms carry its total. Product scope is third. The fourth is the growth assumption, which explains why two firms that start within $9 trillion of each other end up $38 trillion apart a few years later.
Our view: a market size without a scope note is a marketing number. If a deck says "a $36 trillion market", the next line should say what that includes, or a careful investor will discount the whole slide.
What the US government actually measured
The US Census Bureau publishes the only B2B ecommerce figures in this guide that come with a sample design and published error margins. Its latest E-Stats release, published in March 2025, covers 2022, and it counts orders where price and terms are agreed over the internet, an extranet, EDI or another online system (US Census Bureau).
The 2022 figures, in billions of dollars:
- Manufacturing e-shipments: $4,825.9, up from $4,230.8 in 2021.
- Merchant wholesale e-commerce sales, including manufacturers' sales branches and offices: $3,760.2, up from $3,280.0.
- Service industries e-commerce: $1,773.9, up from $1,649.6.
- Retail e-commerce, for comparison: $997.5, up from $936.6.
Three cautions apply. First, never add manufacturing and wholesale together: a product sold online by a manufacturer to a distributor, then online again to a buyer, would be counted twice. Second, Census flags the wholesale figure itself, because only 40.4% of the expected value was reported, and it tells users to take care when drawing conclusions. Third, the series is now old. E-Stats is listed as an inactive program, and e-commerce questions have moved into a newer annual survey with no comparable release yet.
Using these numbers in a pitch or a plan?
In 30 minutes we look at the market your B2B marketplace serves, where buyers find it on Google and in AI answers, and which number tells the real growth story.
What the Census data does well is set a floor. Manufacturing alone, in one country, was worth more online in 2022 than Persistence's estimate for the whole world in 2026. Any global figure below about $5 trillion is therefore measuring something narrower than all online B2B orders, and should say so. When a report gives no scope note, compare its total with this floor before you quote it. If the global number is smaller than one US sector, the report is answering a narrower question than its headline suggests.
B2B ecommerce growth in the US in 2025
US B2B ecommerce grew 13% to $2.93 trillion in 2025, according to Digital Commerce 360's analysis of US Department of Commerce data. In the same year, total US manufacturing and distribution sales rose just 0.4% to $15.12 trillion, after 1.0% in 2024 and 0.4% in 2023.
That gap is the most important B2B ecommerce growth statistic of the year. The overall B2B economy was flat, and digital channels took share inside it. Digital Commerce 360 also states that more than 90% of B2B transactions are now electronic, which only makes sense alongside the $2.93 trillion if EDI sits outside its ecommerce figure.
Older forecasts give the same direction from a different starting point. Forrester's 2022 forecast put US B2B ecommerce at $1.7 trillion in 2021, or 16% of US B2B sales, and predicted $3 trillion and a 24% share by 2027, a 10.7% CAGR. On Digital Commerce 360's numbers, the market reached about $2.93 trillion two years early. Forecasts in this field have tended to be too cautious about digital share, not too bold.
For a B2B marketplace founder, the lesson is about share, not size. Growing at 0.4% in a flat market means losing ground to the channels growing at 13%. Our guide to B2B ecommerce trends covers where that share is moving and why.
B2B marketplace statistics, kept separate
B2B marketplace statistics should never be mixed with general B2B ecommerce figures. A supplier's own web store, an EDI link and a multi-seller marketplace are three different channels, and a founder who blends them overstates the market a marketplace can actually win.
The clearest marketplace-specific estimate comes from Mordor Intelligence, which says marketplace sales held 67.02% of online B2B order value in 2026 and forecasts 13.62% annual growth for that segment from 2027 to 2032 (Mordor Intelligence). That share is high because Mordor counts the large Asian wholesale platforms, so read it as a global figure. It is not a share you can apply to a US vertical.
Company disclosures give the scale of individual platforms:
- Amazon Business reached $60 billion in annualized gross sales in the second quarter of 2026, serving more than 11 million organizations in 11 countries, including 97 of the Fortune 100. In August 2025 it reported more than $35 billion and over 8 million organizations, so gross sales grew by more than two-thirds in under a year.
- Mirakl, which provides marketplace software, reported $14.6 billion of marketplace and dropship gross merchandise value (GMV) across its platform in 2025, up 31%. It does not split out B2B, so treat this as a signal for the model, not for B2B alone.
What we did not find is a trustworthy total for B2B marketplaces alone in 2025. A widely shared $351 billion figure for 2024 comes from a sponsored article, so we leave it out. If you need a marketplace total, build it bottom-up from company disclosures in your vertical and say that you did. Our marketplace metrics guide explains how GMV and take rate relate, which matters when you compare a platform's GMV with its revenue.
How B2B buyers behave online
The buyer data points the same way as the market data: buyers want to research and order without a sales call, and they increasingly use AI tools to do it. The figures below come from named surveys with stated samples.
Gartner's March 2026 survey of 646 B2B buyers found that 67% prefer a rep-free buying experience, up from 61% in its 2025 survey, and that 45% had used AI during a recent purchase. Forrester's State of Business Buying 2026, based on about 18,000 buyers, found that a typical purchase involves 13 internal stakeholders and 9 external influencers. Both are grade B: disclosed samples, but surveys of stated preference, not records of what buyers did.
Two cautions are worth keeping. Preference is not behavior: a buyer who says they prefer no rep may still call one for a large order. And buyer surveys describe buyers in general, so they do not tell you how buyers in your category behave on your platform. We cover that gap in our guide to the B2B buyer journey.
Our view: buyer statistics are best used to justify a product decision, such as instant quotes or published prices, not to size a market. Use them for the "why now", and use Census or company disclosures for the "how big".
Statistics to stop quoting
Some of the most repeated B2B ecommerce statistics are old, misattributed or no longer true. Quoting them signals that the writer did not check, which costs more credibility than the number earns.
- "80% of B2B sales interactions will happen in digital channels by 2025." This was a Gartner prediction from September 2020. 2025 has passed, and it was never a measurement, so do not present it as a current fact.
- "The global B2B ecommerce market was $12.2 trillion." This is a 2019 figure that still circulates in roundups. It predates every forecast above and should be retired.
- "71% of buyers will leave a seller without real-time inventory." We could not trace this to a primary page. Several roundups attribute it to McKinsey without a link.
- Any single "market size" with no year, scope or publisher. If you cannot say what it includes, you cannot defend it.
- Older Mordor editions. Roundups still quote $33.02 trillion for 2025 and $61.66 trillion for 2031 from a previous edition. Use the current page and do not mix editions.
When a statistic appears in ten roundups and none of them links to the original, it is usually because the original no longer says it.
What 62 B2B marketplace rankings taught us
Our own data adds a bottom-up view. Between October 7 and November 9, 2026, we published 62 industry rankings of B2B marketplaces and directories, naming 360 companies, and tracked 838 more platforms in the same categories that were not named. That is roughly 1,200 B2B marketplaces, directories and exchanges across sectors from freight to chemicals to oil and gas.
Three patterns stood out. First, scale claims rarely use the same unit. In our rankings of telecom, construction, insurance and warehousing platforms, we found coverage counted as data centers, firms, carriers or buildings, never as one comparable number. Second, most platforms publish a buyer or supplier count but very few publish GMV, which is why bottom-up market totals are hard to build. Third, many verticals still have no clear leader: in sectors such as insurance, telecom and warehousing, the biggest platforms are specialists that serve one part of the industry.
The practical conclusion for founders is that a vertical B2B marketplace rarely competes against "the B2B ecommerce market". It competes against a handful of specialists, a few horizontal giants and the phone. That is a much smaller and more winnable fight, and our guide to vertical marketplaces explains why niche platforms often win it.
Three ways a good statistic goes wrong
These patterns recur when a correct number is used for the wrong job. The examples are illustrative, and the costs are the kind we see in fundraising and planning, not audited figures.
- The trillion-dollar slide. A founder raising a seed round for a US industrial B2B marketplace opens with "$36 trillion global market". An investor asks how much of it is US, how much is the founder's category and how much flows through marketplaces. The founder has no answer, and the meeting moves on. A bottom-up estimate for one category, with Census as the floor, would have taken a day and kept the conversation on the business.
- The double count. An analyst adds Census manufacturing and wholesale figures to report "$8.6 trillion of US B2B ecommerce". A journalist repeats it. Census's own definitions mean some of that value is counted twice, and the correction costs the analyst's next three pitches their credibility.
- The expired prediction. A marketplace's sales deck still says "80% of B2B interactions will be digital by 2025" in late 2026. A procurement lead notices the date, and the deck's other claims are read with suspicion. Replacing it with a dated 2026 survey figure would have cost ten minutes.
Is your B2B marketplace the source buyers and AI answers quote?
A growth audit shows how buyers search for your category, which pages win citations in AI answers, and where your own data could become the statistic others link to.
In each case the number itself was real. The failure was in matching it to the claim. A one-line scope note under every statistic, stating year, geography and what is counted, prevents all three, and it is the single habit we would ask any team to adopt before its next board pack or press release. It also makes your own content more likely to be quoted, because writers and AI answers both prefer a figure that arrives with its context attached.
Which number to use, and when
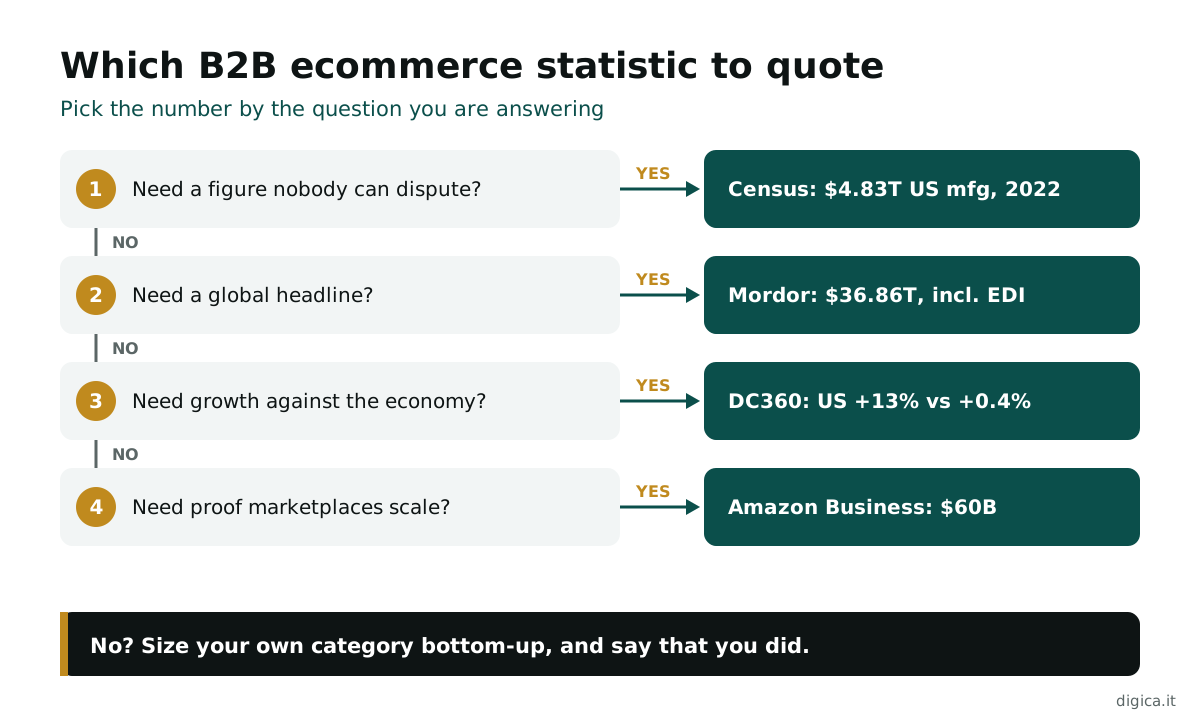
Pick the statistic by the question you are answering, not by the size of the number. Use these thresholds as a starting point.
- If you need a figure nobody can dispute, use Census: $4,825.9 billion of US manufacturing e-shipments in 2022, with the year stated.
- If you need a global headline, use Mordor Intelligence's $36.86 trillion for 2026, and add "including EDI and marketplaces".
- If you need growth against the wider economy, use Digital Commerce 360: US B2B ecommerce up 13% in 2025, against 0.4% for all US manufacturing and distribution sales.
- If you need proof that B2B marketplaces work at scale, use Amazon Business: $60 billion in annualized gross sales in 2026 (Amazon).
- If you need a marketplace share, use Mordor's 67.02% for 2026 and say it is global and Asia-weighted. For a US vertical, build your own figure.
- If a statistic is more than three years old or has no primary link, do not use it, however often you have seen it.
- If your category is smaller than about $10 billion a year online, skip the global figures entirely and size it from the bottom up.
Bottom-up sizing for a single vertical usually beats any headline. Count the buyers in your category, multiply by their annual spend in your product range, and apply an online share you can source. Our guide to marketplace fees and take rates then turns that GMV into revenue.
What the B2B ecommerce market is worth to a marketplace
The market is worth what your share of the shift online is worth. With total B2B sales flat and digital channels growing 13% a year in the US, a B2B marketplace grows by taking orders away from reps, distributors and supplier portals, not by waiting for the market to rise.
Run an illustrative case. A vertical B2B marketplace in a category with $2 billion of annual online orders holds a 2% share, or $40 million of GMV. If the online channel grows 13% a year and the platform only holds its share, GMV rises to about $45 million next year. If it also wins one extra point of share, GMV reaches about $68 million. At a 10% take rate, that point of share is worth about $2.3 million in revenue a year. The inputs are illustrative, so replace them with your own.
Growing a B2B marketplace in a flat market?
We help B2B marketplaces win share in the channels that are growing: search, AI answers and the supply that makes buyers stay.
That is the work we do: we grew a B2B agency marketplace from five people to 40,000+ listed agencies and 1M+ monthly users, and helped a water and wastewater marketplace reach 10x+ organic impressions within six months. The number to take into your next board meeting is your growth rate against the 13% the online channel grew in 2025. If you grew more slowly, you lost share, and the biggest cost of doing nothing is that buyers who now start their research online settle on someone else.
FAQ
How big is the B2B ecommerce market in 2026? Estimates range from $3.8 trillion to $36.86 trillion. Mordor Intelligence's $36.86 trillion is the best-documented global figure, because it states that it includes EDI, webstores and marketplaces. Always quote the scope with the number.
What is the B2B ecommerce market size in the US? Digital Commerce 360 estimated US B2B ecommerce at $2.93 trillion in 2025. The US Census Bureau measured $4,825.9 billion of manufacturing e-shipments in 2022, a figure that includes EDI, so it is larger.
How fast is B2B ecommerce growing? US B2B ecommerce grew 13% in 2025, according to Digital Commerce 360, while total US manufacturing and distribution sales grew 0.4%. Global forecasts range from about 10.6% to 20.9% a year, depending on the firm.
Why do B2B ecommerce market size estimates differ so much? Mainly because of EDI, geography and product scope. Firms that count orders placed over EDI land in the tens of trillions. Others exclude it, focus on certain regions or product categories, or measure only marketplace models.
What share of B2B ecommerce goes through marketplaces? Mordor Intelligence estimates that marketplace sales held 67.02% of online B2B order value in 2026. That figure is global and weighted toward Asia-Pacific, so it overstates the share in most US and European verticals.
What is the largest B2B marketplace? Among platforms that publish comparable figures, Amazon Business reported $60 billion in annualized gross sales in 2026, serving more than 11 million organizations, including 97 of the Fortune 100.
Related Articles
- B2B marketplaces and directories
- B2B marketplace growth strategy: what works in 2026
- B2B ecommerce trends 2026 for marketplace operators
- Marketplace fees and take rates: B2B benchmarks
- Best B2B ecommerce marketplace platforms
Where this connects
This article is part of our B2B marketplace growth series. Browse more on the Digica blog.