Marketplace metrics: GMV, take rate and the core KPIs investors ask a B2B marketplace for
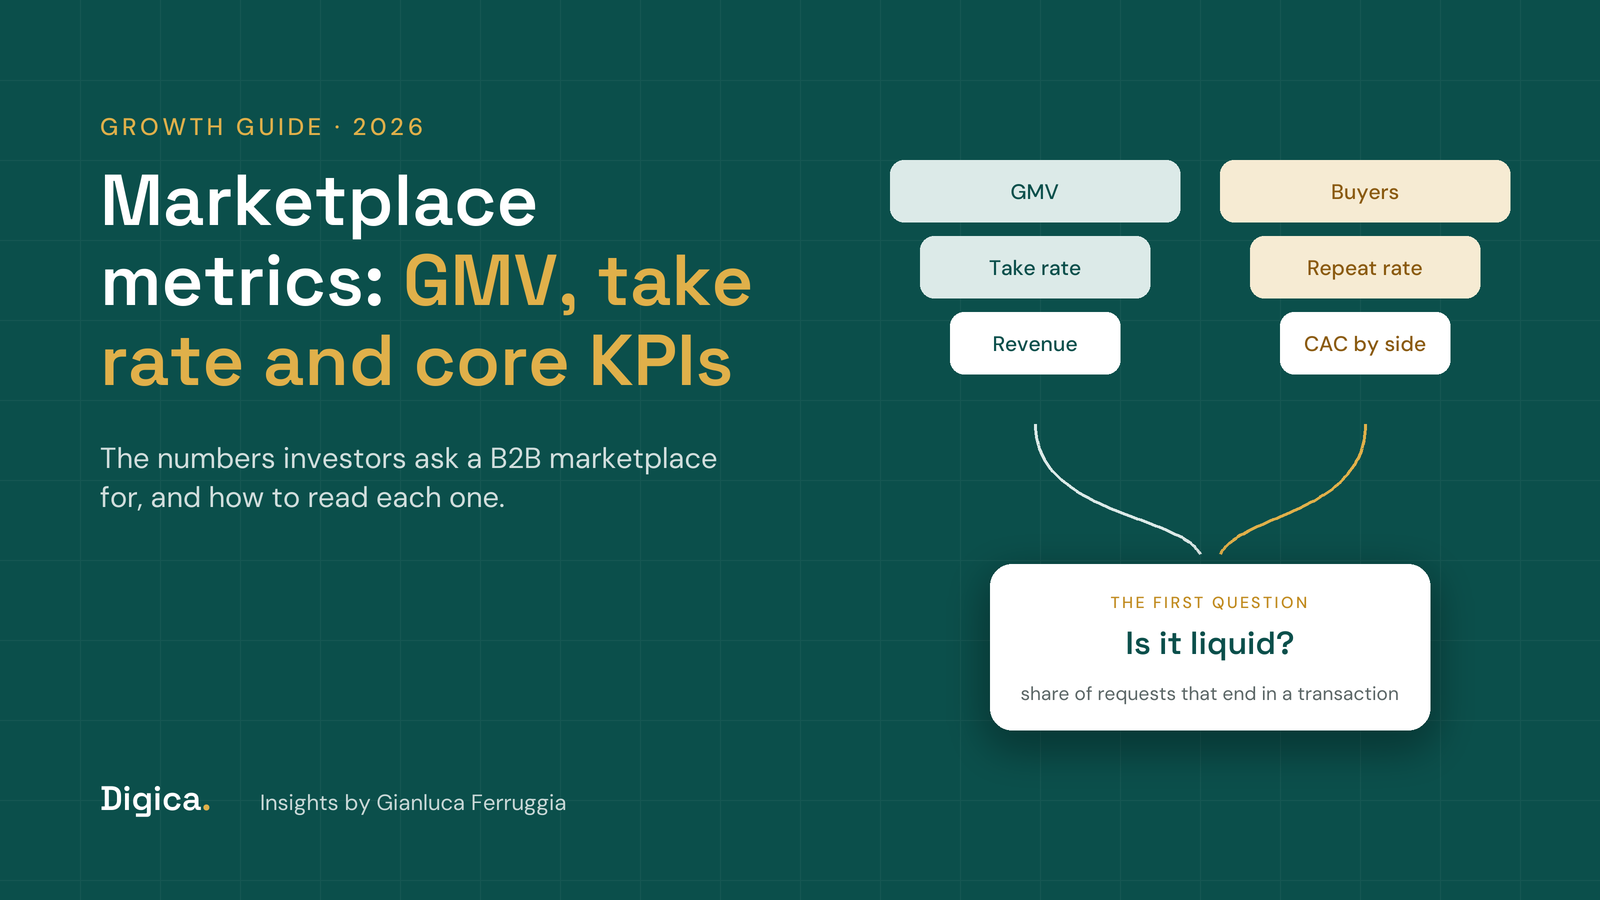
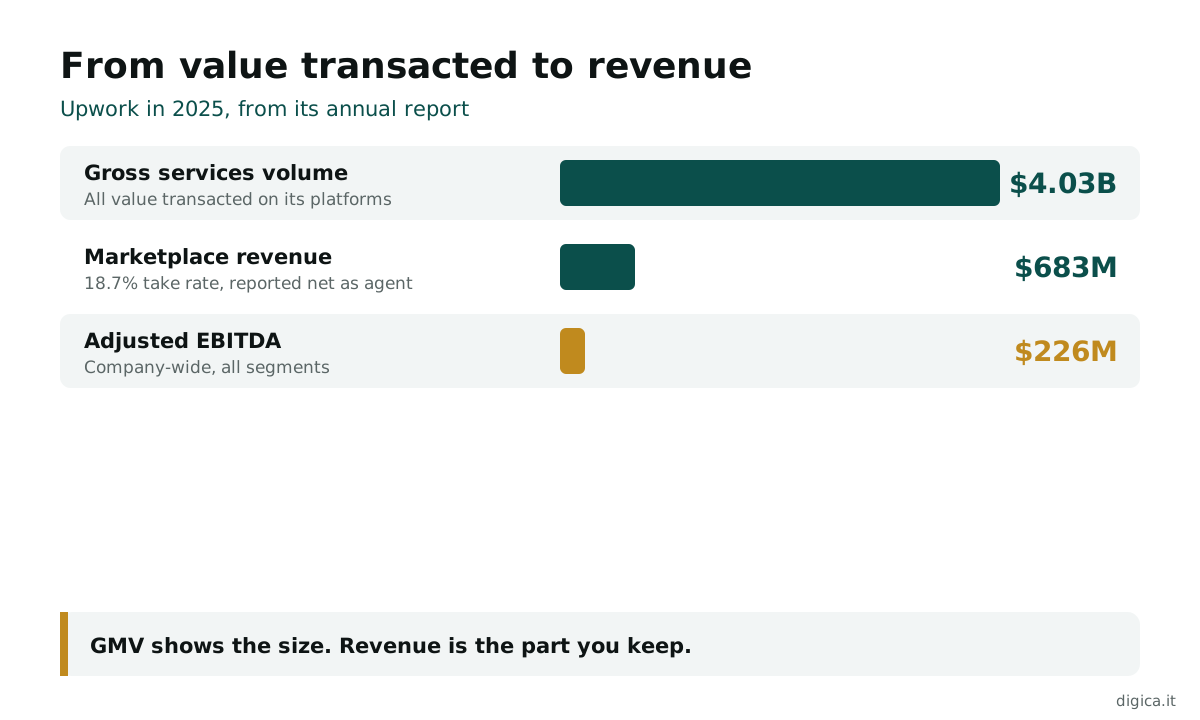
Marketplace metrics are where a B2B marketplace's story meets its numbers, and most founders preparing for investors lead with the wrong one. Gross merchandise value (GMV) is the biggest number on the dashboard, so it goes on the first slide. But GMV is not revenue, and investors know it. Upwork enabled $4.03 billion of gross services volume in 2025 and recognized $682.9 million of marketplace revenue on it, an 18.7% take rate (Upwork 2025 Form 10-K). The gap between those two numbers is where the questions start.
The questions that follow are predictable. How much of that value do you keep? Do buyers find what they came for? Do they come back? What does it cost to win each side? We have sat on the operator side of those conversations, including at a B2B agency marketplace that grew from five people to 40,000+ listed agencies and 1M+ monthly users, and the founders who answer well have one thing in common: they report a small set of numbers that connect to each other.
This guide covers the marketplace KPIs investors ask for and how to read them: GMV against revenue, take rate, liquidity and fill rate, repeat rate and cohorts, and acquisition cost on each side. It is written for founders and operators of B2B marketplaces preparing for a raise or a board meeting. It uses the public filings of two listed marketplaces as worked examples, and our own experience for the rest. For the one metric that compounds above all others, read our guide to marketplace liquidity.
Quick Navigation
- Why marketplace metrics decide the next round
- GMV against revenue: what a GMV marketplace number really says
- Take rate: the price of your B2B marketplace
- Liquidity and fill rate: proof the model works
- Repeat rate and cohorts: do buyers come back
- Acquisition cost by side
- Marketplace KPIs side by side
- Three failure scenarios
- Which marketplace metrics to report: a decision framework
- What clean metrics are worth
- FAQ
- Related Articles
Why marketplace metrics decide the next round
The short answer: investors use marketplace metrics to answer one question, whether supply and demand are meeting often enough, and profitably enough, to compound. A dashboard that shows activity without showing matches does not answer it.
Founders tend to report what is easy to count and flattering to show: registered users, listings, page views, total GMV since launch. Each of those can rise while the business stalls. A B2B marketplace can double its listings and halve its match rate in the same quarter, because new suppliers arrive faster than new demand.
We see the same habit in public. Across the 48 rankings of B2B marketplaces and directories we had published by November 1, 2026, naming 274 companies, the figure a platform chose to publish about itself was usually a count of supply: listings, suppliers, members or SKUs. Supply counts are useful. They are not evidence that anyone is buying.
Our view is direct: lead with the numbers that show transactions, then use supply counts to explain them. An investor who sees a clean chain from GMV to revenue to repeat buyers asks better questions, and spends less of the meeting checking whether your numbers mean what you say.
GMV against revenue: what a GMV marketplace number really says
The short answer: GMV is the total value of transactions that pass through your B2B marketplace. Revenue is the part you keep. Investors value the second and use the first to understand its size and direction.
Fiverr defines GMV in its 2025 annual report as the total value of transactions ordered through its marketplace, excluding taxes, chargebacks and refunds. Upwork calls the equivalent gross services volume, the total dollar value transacted through its platforms. Both then report revenue on a net basis, as an agent, because neither controls the service being bought. Upwork's 10-K says it presents talent service fees on a net basis because talent and clients negotiate scope and price directly with each other.
That accounting choice is the reason GMV and revenue diverge. If your B2B marketplace takes title to goods, holds stock or controls the service, you may report revenue gross, and your revenue will look much closer to GMV. If you connect buyers and sellers who transact with each other, you report your fee. Investors know the difference. A founder who presents gross GMV beside a gross-looking revenue line, without saying which model applies, invites a long conversation with the finance team.
Two other GMV traps come up repeatedly. Cumulative GMV since launch hides the trend, so report it by month or quarter. And GMV that includes cancelled or refunded orders flatters the number, so state what you exclude. Upwork's 10-K is candid on this point: it says its metrics are tracked with internal tools that are not independently verified by any third party. If a listed company says that about its own metrics, a private B2B marketplace should define its own just as carefully.
Take rate: the price of your B2B marketplace
The short answer: take rate is revenue divided by GMV over the same period. It is the price buyers and sellers pay for your B2B marketplace, expressed as a share of what they transact.
Fiverr's definition is the cleanest: marketplace revenue for a period divided by GMV for that period. Its take rate was 27.7% in 2025, up from 27.6% in 2024, which it put down to slight adjustments in its fee structure. Upwork's rose from 18.0% in 2024 to 18.7% in 2025, which it put down to growing contributions from ads and monetization products. In 2023 it had been 15.4%.
Preparing your B2B marketplace for investors?
In 30 minutes we look at the numbers you report, where liquidity and repeat buying really stand, and what we would fix first before you put them in front of a board.
Read those two figures together and the pattern is clear. Both companies raised take rate while their transaction volume stood still. Fiverr's marketplace GMV fell 2.2% in 2025 and its marketplace revenue fell only 1.8%, while total revenue rose 10.1% to $430.9 million thanks to $45.0 million more from services such as advertising and subscriptions.
A rising take rate is not good or bad on its own. It is good when buyers and sellers pay more for something they value, such as promotion, faster matching or payment protection. It is a warning when it comes from fees that push transactions off the platform, which is called leakage. Investors will ask which it is. Our guide to marketplace business models covers how B2B platforms charge, and when to start.
Liquidity and fill rate: proof the model works
The short answer: liquidity is the share of buyer requests or listings that end in a transaction, and fill rate is the same idea measured on demand: of the requests, orders or jobs posted, how many were filled. It is the single best evidence that a B2B marketplace works.
Liquidity sits under every other number. GMV grows when more requests are filled. Take rate can rise when buyers trust that the platform will deliver. Repeat rate rises when first requests succeed. A B2B marketplace with a low fill rate can buy GMV with marketing for a while, but every unfilled request teaches a buyer to look elsewhere next time.
Measure it at the level where buyers experience it: by category, by region and by request type. A healthy average can hide one large category that never fills. We cover how to measure it, and the volumes where a B2B marketplace starts to behave like one, in liquidity is the only marketplace metric that compounds, and our marketplace liquidity work starts from exactly this breakdown.
Time to fill matters as much as the rate. A request filled in two hours and a request filled in two weeks both count as filled, but only one of them wins the buyer's next request. Report median time to first useful response alongside fill rate, by category.
Repeat rate and cohorts: do buyers come back
The short answer: repeat rate is the share of buyers who transact again within a set period, and cohort analysis tracks each month's or quarter's new buyers over time. Together they show whether GMV is built on loyal demand or on constant replacement.
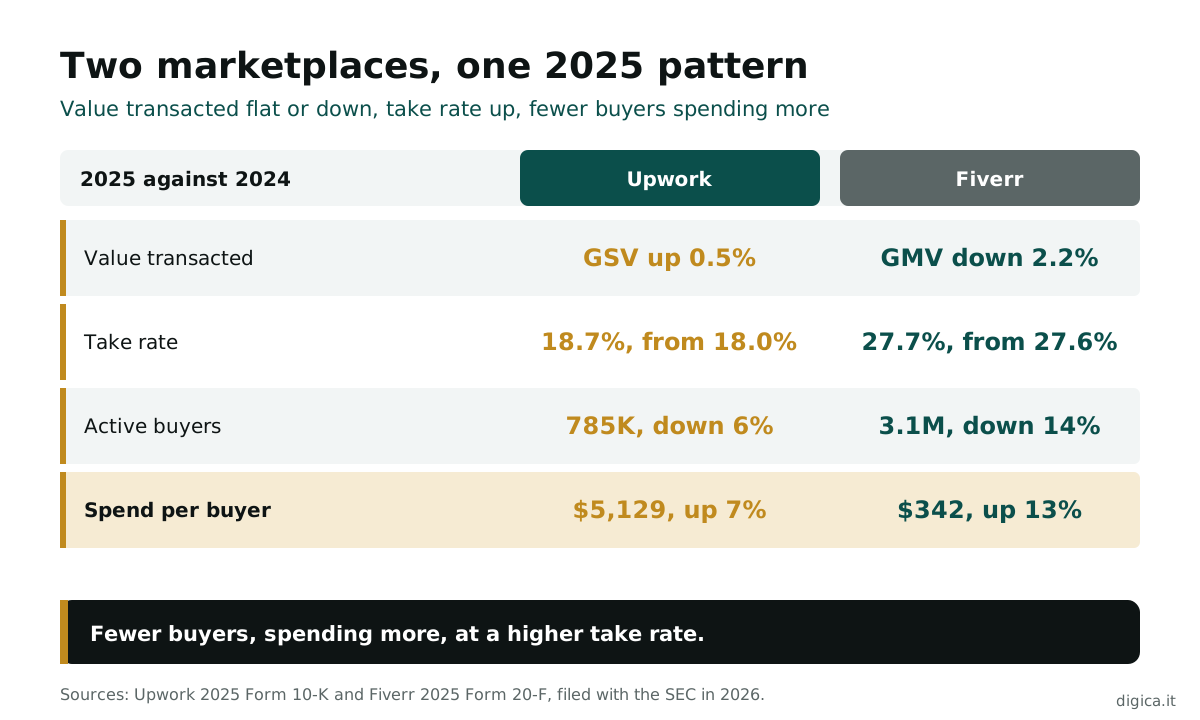
The public examples are instructive. Upwork ended 2025 with 785,000 active clients, down 6%, but gross services volume per active client rose 7% to $5,129. Fiverr ended 2025 with 3.1 million annual active buyers, down from 3.6 million, while annual spend per buyer rose 13.3% to $342 (Fiverr 2025 annual report). Both businesses lost buyers and kept volume steady by getting more from the buyers who stayed.
That is a cohort story, and investors will want to see yours. Show what share of each quarter's new buyers placed a second order within 90 days, and what share were still buying a year later. Show the same for sellers. A B2B marketplace where 60% of buyers return within a quarter can afford a higher acquisition cost than one where 15% return, and the cohort chart is how you prove which one you are.
Retention is also where partner and referral channels show their value. In a SaaS partner and referral program we worked on, 94% of referred SaaS accounts were still active after onboarding. Referred customers tend to arrive with a use case already in mind, which is why acquisition channel belongs in every cohort view.
Acquisition cost by side
The short answer: a B2B marketplace has two acquisition costs, one for buyers and one for sellers, and investors want both, set against what each side is worth over time. A single blended customer acquisition cost (CAC) hides which side the business is paying to fill.
The two sides rarely cost the same. Early on, suppliers are usually recruited by hand, through sales calls and onboarding, and buyers are acquired through search, content and paid campaigns. Later, a healthy B2B marketplace often finds that suppliers start to arrive on their own because buyers are there. If supply acquisition cost is not falling as demand grows, the network effect is weaker than the pitch deck says.
Organic search is the channel that most often bends acquisition cost down over time, because pages keep earning visits after they are built. A water and wastewater marketplace we worked with reached 10x+ organic impressions within six months. Our guide to how B2B marketplaces reach 1M monthly organic visitors explains the page architecture behind that kind of curve.
Are your acquisition costs falling as you grow?
A growth audit maps where your buyers and suppliers actually come from, on Google, in AI answers and through partners, and which pages and channels could lower the cost of each side.
Report acquisition cost by side and by channel, next to the payback period on each: how many months of take-rate revenue from a new buyer or seller it takes to repay what you spent to win them. In our experience, payback under 12 months on the demand side makes for an easy investor conversation, and anything over 24 months needs a strong retention story behind it.
Marketplace KPIs side by side
The short answer: eight metrics cover what investors ask about most, and each one answers a different question. Report them together so each explains the others.
Eight marketplace KPIs compared on what each measures, how to calculate it, what investors read into it, its main risk and when it matters most
| Metric | What it measures | How to calculate | What investors read | Main risk | Best for |
|---|---|---|---|---|---|
| GMV | Value transacted | Sum of completed transactions, net of refunds | Size and direction | Cumulative or gross figures that flatter | Every stage, by month |
| Net revenue | What you keep | Fees and other revenue, net if you act as agent | The business itself | Confusing gross and net | Every stage |
| Take rate | Price of the platform | Revenue divided by GMV, same period | Pricing power | Fees that drive leakage | After liquidity holds |
| Liquidity | Matches made | Transactions divided by requests or listings | Whether the model works | Averages that hide empty categories | Pre-seed to Series A |
| Fill rate and time to fill | Demand served | Requests filled, and median time to fill | Buyer experience | Counting late fills as success | Request-led B2B marketplaces |
| Repeat rate | Buyers returning | Share of buyers with a second order in 90 days | Loyalty and efficiency | Short windows for slow categories | Seed onwards |
| Cohort retention | Lasting demand | Share of each cohort still active at 12 months | Durability of GMV | Too few cohorts to read | Series A onwards |
| CAC by side | Cost to win each side | Spend per new buyer or seller, by channel | Network effects | Blended CAC hiding one side | Every stage |
The table is the minimum set, not the maximum. Contribution margin, the revenue left after payment, support and fulfillment costs, belongs alongside it once a B2B marketplace handles payments or logistics.
Three failure scenarios
These are the patterns that recur when B2B marketplaces take their metrics into an investor meeting.
- The GMV that turned out to be gross revenue. A materials B2B marketplace buys stock from suppliers and resells it, then presents $30 million of GMV and $30 million of revenue next to the take rate of an asset-light platform. Investors discover in diligence that it is a distributor with a website, with gross margins near 12%. Presenting itself as a distributor from the start, with clear margins, would have found the right investors in half the time.
- The take rate that emptied the platform. A services B2B marketplace raises its commission from 10% to 18% to hit a revenue target before a raise. GMV holds for one quarter, then repeat buyers start paying sellers directly. Raising the fee only where it paid for something new, such as payment protection or faster matching, would have kept the transactions on the platform.
- The averages that hid an empty category. A B2B marketplace reports a 70% fill rate across all categories. In diligence, an investor splits it and finds its largest category fills at 30%, carried by two small ones near 100%. Reporting fill rate by category from the start, and fixing the large one first, would have turned a diligence problem into a growth plan.
Each team had real traction. None of them reported it in a way that held up under the first serious question.
Which marketplace metrics to report: a decision framework
The short answer: report the metrics that match your stage, define each one in writing, and show them as a chain from transactions to revenue to retention.
- If you have fewer than 100 transactions a month, report liquidity, fill rate and time to fill by category. GMV at this stage tells investors little.
- If you have product-market fit in one category, add GMV by month, net revenue and take rate, with the accounting basis stated.
- If you have at least four quarters of buyers, add repeat rate at 90 days and cohort retention at 12 months, for buyers and sellers.
- If your take rate rose by more than 2 points in a year, show what buyers or sellers got for it, and show leakage indicators such as repeat pairs that stopped transacting.
- If you spend on acquisition on both sides, report CAC and payback by side and by channel, not blended.
- If you take title to goods or control the service, say so on the first slide and lead with gross margin rather than take rate.
Subscription B2B marketplaces need one adjustment. If suppliers pay a subscription rather than a commission, investors look at collections and deferred revenue as well as recognized revenue. IndiaMART, which charges paying suppliers subscriptions, reported 9% year-on-year growth in collections and 16% growth in deferred revenue for the quarter to September 30, 2026 (IndiaMART). For that model, those numbers do the job take rate does for a commission model.
Want help with the numbers behind the story?
Our B2B marketplace growth consulting works on the metrics investors read first, liquidity, repeat buying and acquisition cost by side, with your own team, inside your roadmap.
Write the definitions down once and keep them. A founder who changes how GMV or an active buyer is counted between two board meetings loses more credibility than any weak quarter would cost. Our B2B marketplace growth strategy covers how these metrics fit the wider plan, and our guide to growing a B2B marketplace stage by stage shows which to watch at each stage.
What clean metrics are worth
The short answer: clean marketplace metrics are worth a shorter diligence process and a valuation built on evidence rather than on a story. They also show the team where growth will come from next.
Run the numbers on repeat rate, the metric most often missing from early decks. Suppose a B2B marketplace wins 1,000 new buyers a year, each spending $5,000 a year at a 10% take rate, so each repeat buyer is worth $500 a year in revenue. If 40% return in their second year, that cohort brings $200,000 of second-year revenue. Lift the return rate to 50% and it brings $250,000, an extra $50,000 for no additional acquisition spend, and the gain repeats with every cohort. The arithmetic is illustrative, but it shows why investors ask about repeat buying before they ask about growth.
That is what we mean by leads and organic growth from the same engine. One engine, two outputs: qualified leads this quarter, organic growth that keeps paying after. Metrics are how you show an investor the engine is running.
The number to take into your next board meeting is repeat rate by cohort, beside take rate. If you can show both holding while GMV grows, the payback on every acquisition dollar shortens with each quarter. The biggest cost of doing nothing is walking into a raise with a GMV slide and no answer to the first question about what share of it you keep, and who comes back.
FAQ
What are the most important marketplace metrics? For a B2B marketplace, the core set is GMV, net revenue, take rate, liquidity or fill rate, repeat rate, cohort retention and acquisition cost on each side. Liquidity matters most early on, because every other metric depends on buyers finding what they came for.
What is GMV in a marketplace? GMV, or gross merchandise value, is the total value of transactions that pass through a marketplace in a period, usually excluding taxes, refunds and chargebacks. It measures the size of activity on the platform, not the platform's own revenue.
How do you calculate take rate? Divide the marketplace's revenue for a period by its GMV for the same period. Upwork reported an 18.7% marketplace take rate for 2025 and Fiverr 27.7%, both calculated this way.
Is GMV the same as revenue? No. When a B2B marketplace connects buyers and sellers who transact with each other, it usually reports only its fees as revenue, on a net basis. GMV and revenue are close only when the platform takes title to goods or controls the service it sells.
What marketplace KPIs do investors ask for at seed stage? At seed stage investors usually focus on liquidity, fill rate, time to fill and early repeat rate in one category, plus the cost of acquiring each side. GMV and take rate matter more once the first category is working.
What is a good take rate for a B2B marketplace? There is no single benchmark, because take rate depends on how much the platform does for each transaction. A good take rate is one buyers and sellers keep paying without moving transactions off the platform, which repeat rate and leakage show over time.
How do subscription B2B marketplaces report metrics? When suppliers pay subscriptions instead of commissions, the key numbers are paying suppliers, revenue per paying supplier, collections and deferred revenue, alongside buyer activity. Take rate does not apply in the same way.
Related Articles
- Marketplace liquidity
- Liquidity is the only marketplace metric that compounds
- Marketplace business models: how B2B platforms make money
- B2B marketplace growth strategy: what works in 2026
- How to grow a B2B marketplace: a stage-by-stage guide
- How to build a B2B marketplace: the order that works
- How B2B marketplaces reach 1M monthly organic visitors
Where this connects
This article is part of our B2B marketplace growth series. Browse more on the Digica blog.