What 243 online B2B marketplaces taught us about growth
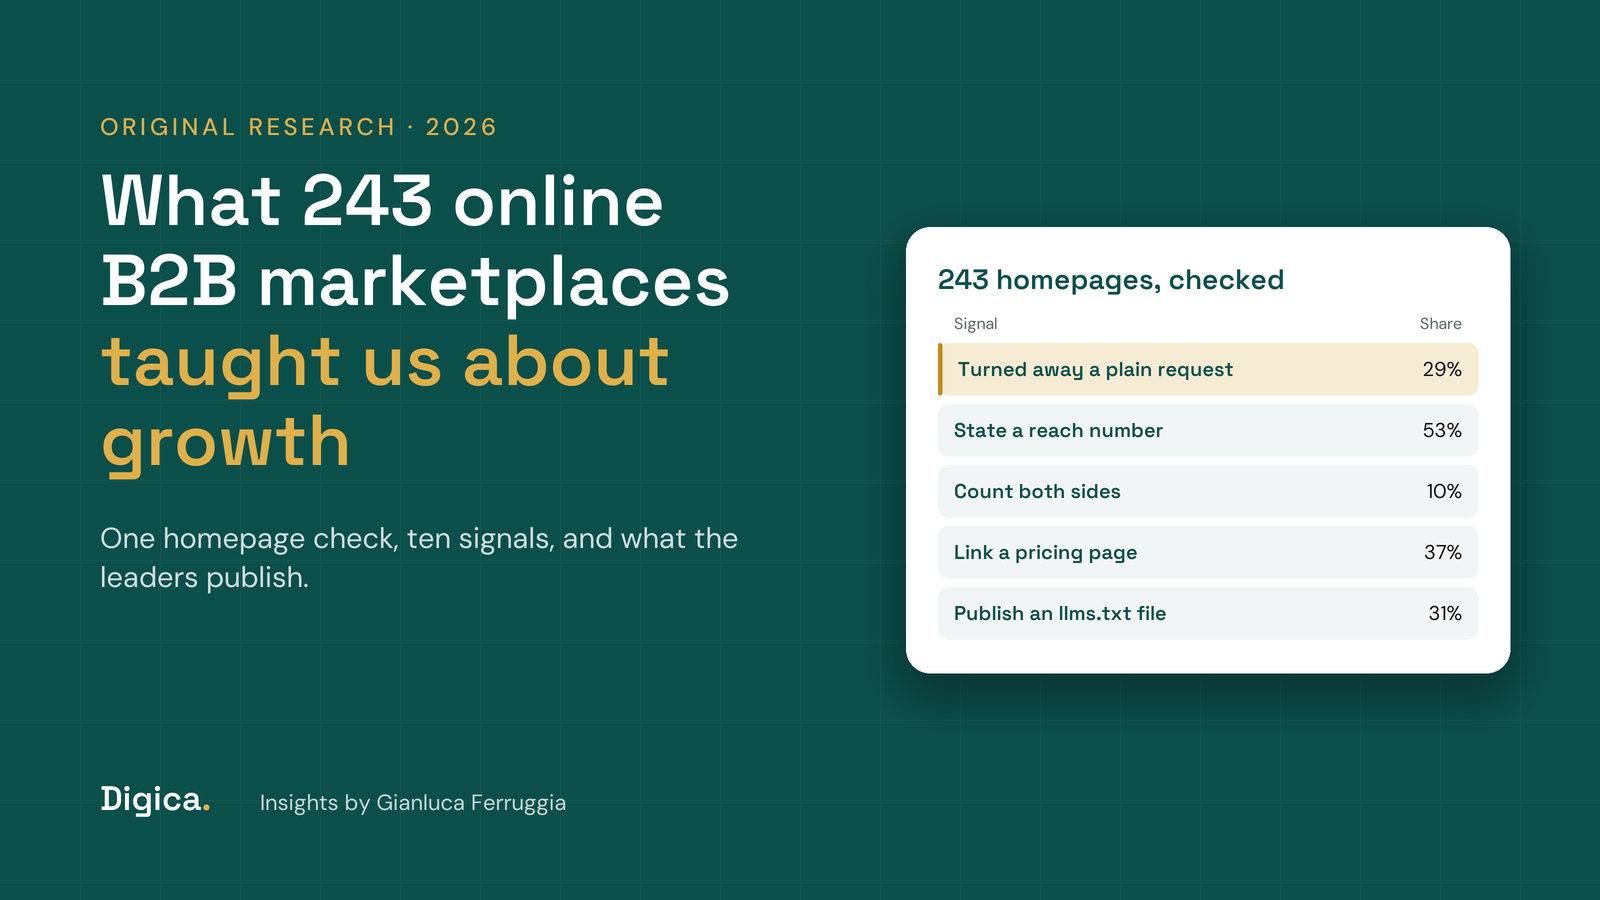
We checked the homepages of 243 online B2B marketplaces, directories and exchanges on one day, and 70 of them, or 29%, turned our request away before showing a single word. Of the 173 we could read, only 91 stated how big they are, and just 17 gave a number for both the buyers and the sellers they connect. For an online B2B marketplace, those gaps are not cosmetic. They decide whether a buyer, a search engine or an AI assistant can tell what the platform is and why it matters.
The surprise was how little the leaders have in common beyond the basics. Almost all of them publish content. Far fewer publish proof, prices or a page that a machine can read without running scripts. Size did not predict any of it: some of the largest platforms in our rankings served the thinnest pages, and some small specialists did everything right.
This study draws on every company named in Digica's published industry rankings, across 45 sectors from freight to chemicals. It is written for founders and operators growing a B2B marketplace who want to know what the platforms they compete with actually publish, and what to fix first. If you want named examples by sector, our list of the biggest B2B marketplaces is the place to start.
Quick Navigation
- How we studied 243 online B2B marketplaces
- Lesson 1: many pages turn readers away
- Lesson 2: half say how big they are, few count both sides
- Lesson 3: content is everywhere, proof is not
- Lesson 4: how B2B marketplaces charge, and who says so
- Lesson 5: machine-readable pages are still the minority
- The scorecard: what the leaders publish
- What 64 rankings taught us beyond the homepage
- Three failure scenarios
- Where to start: a decision framework
- What fixing the homepage is worth
- FAQ
- Related Articles
How we studied 243 online B2B marketplaces
We took the website of every company named in our rankings, 331 in all, and kept the 243 that run a B2B marketplace, directory or exchange. We set aside communities, software vendors, data providers and annotation firms, because their homepages do a different job. On November 11, 2026, we requested each page once with a plain, scripted request, the way a simple crawler does, and recorded what came back.
For each page we could read, we checked ten things: whether it states a reach number (such as "15,000+ buyers"), whether it counts both sides, whether it links a pricing page, a blog or resources hub, and case studies, whether it carries structured data, whether the site publishes an llms.txt file, and whether it offers free listing, a demo call or a review rating. We also counted the words of text in the page before any script runs.
The method has limits, and they matter for how you read the numbers. A single scripted request is not a browser, so a blocked page may load fine for a person. Our checks look for links and patterns, not meaning, so a "pricing" link can lead to a contact form. We used the page our rankings link to, which is sometimes a product page inside a larger site. Treat every share below as a strong signal, not an audit.
Our view: the homepage is the one page every buyer, journalist and assistant reads before deciding whether to read more. It deserves the attention most teams give to their paid campaigns.
Lesson 1: many pages turn readers away
Seventy of the 243 platforms, 29%, answered our request with an error instead of the page, almost all of them "403 Forbidden". Industrial platforms were the most closed: 8 of the 12 we checked refused the request. Among talent platforms it was 4 of 12, and in commercial real estate 4 of 6.
Most of these blocks come from bot protection that treats any unfamiliar visitor as a threat. That protects the site, but it also stops some crawlers that would have sent buyers. Cloudflare, which manages traffic for about 20% of the web, began asking every new domain on July 1, 2025 whether to allow AI crawlers, and blocks them by default for sites that do not (Cloudflare). Sites already on its service can switch the block on with one click, and more than one million customers had. A B2B marketplace that never made that decision on purpose may already be invisible to the assistants its buyers use.
Readable is not the same as useful. Fifteen of the 173 pages we could open, 9%, held fewer than 150 words of text before scripts ran, so a crawler that does not run JavaScript sees an almost empty shell. Four more showed animated counters that read "0 M+" or "0+" in the raw page, so the platform's headline number reaches machines as zero.
The threat is quiet. Nobody files a complaint when an assistant leaves you off a shortlist. The opportunity is cheap: allowing the crawlers you want and rendering your key text on the server is usually a few days of work, and our guide to GEO for marketplaces covers which crawlers matter.
Lesson 2: half say how big they are, few count both sides
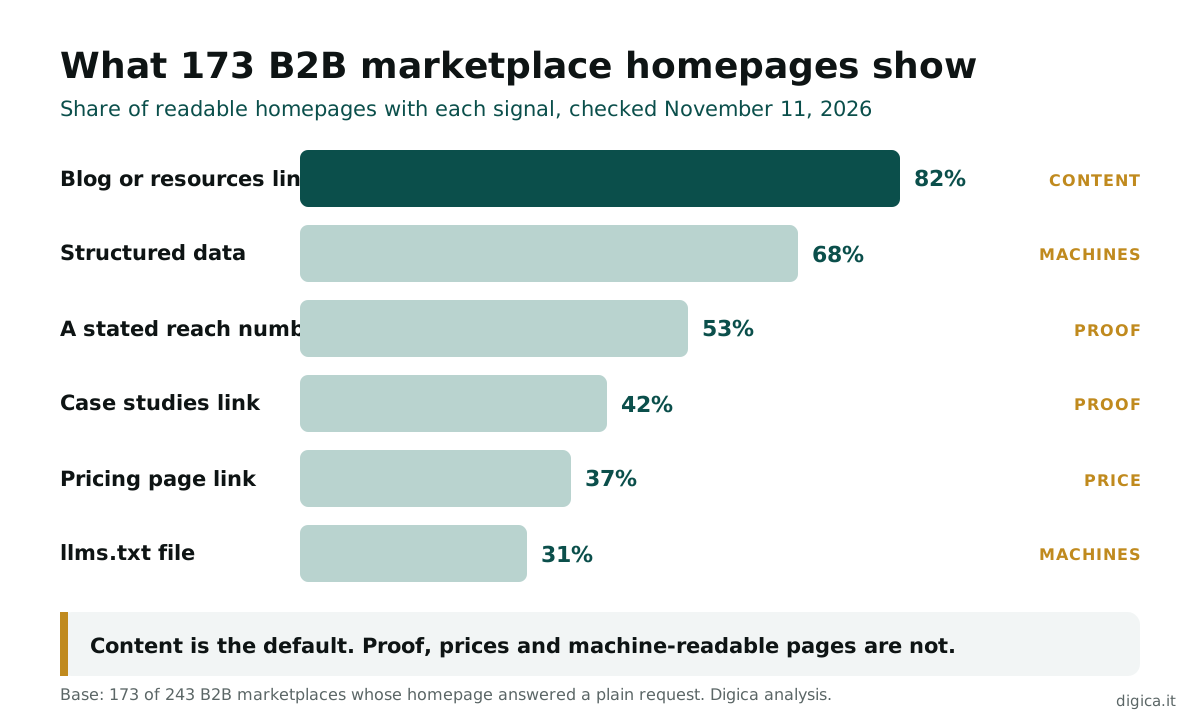
Ninety-one of the 173 readable pages, 53%, stated a reach number in plain text. The rest described themselves with adjectives: "leading", "trusted", "global". For a buyer comparing three platforms, an adjective is not evidence, and for an assistant writing a shortlist, it is nothing to quote.
The bigger gap is balance. Only 17 pages, about 10%, counted both sides of the B2B marketplace on the homepage. RangeMe states 15,000+ buyers next to 200,000+ brands. Tagvenue states 22K venues and 1M+ customers. Guidechem gives 58,000+ suppliers and 83,000+ customers, and Eden McCallum shows 2,500+ consultants and 500+ clients. Each of those pages answers the first question a new user asks, which is whether the other side is big enough to be worth joining.
Most platforms count the side they are proudest of. Supply-side units (suppliers, sellers, experts, venues) appeared on 48 pages, demand-side units (buyers, customers, businesses, users) on 45, and inventory units (products, SKUs, listings, parts) on 21. Very few used transactions or orders, which are the hardest numbers to inflate and the most persuasive.
The trade-off is real. A supplier count with no buyer count tells a supplier the space is crowded, and a buyer count with no supplier count tells a buyer the choice is thin. The fix costs nothing but a decision on which unit to use, and it is the same decision behind our work on marketplace liquidity.
Lesson 3: content is everywhere, proof is not
Content is now the default. 141 of the 173 readable pages, 82%, link a blog, resources hub, guides or news section. Only 73, or 42%, link case studies or customer stories, and just 33, 19%, show a review rating or a link to a review site. The leaders publish plenty of words and much less evidence.
That matters more in B2B than in consumer buying, because the person choosing a platform has to defend the choice to colleagues. Gartner found that 61% of B2B buyers prefer a buying experience with no sales rep, and that 69% saw inconsistencies between what a supplier's website said and what its sellers told them (Gartner). A buyer who prefers not to talk to anyone needs the proof on the page.
A pattern that recurs across the platforms we rank: the blog is written for search traffic, and nobody owns the proof. The result is hundreds of articles and three logos. Our opinion is that one case study with a number in the headline does more for conversion than ten new articles, and it is also the page journalists and assistants quote.
How does your homepage compare?
In 30 minutes we look at what your B2B marketplace publishes against the leaders in your sector, and which gap is costing you buyers or suppliers first.
Proof also compounds in a way content does not. A blog post ages. A case study with a dated result keeps working as long as it is true, and every earned editorial placement that cites it points readers back to the page that converts. If you only have budget for one new page this quarter, make it a case study with a number in the headline, a named sector and a date.
Lesson 4: how B2B marketplaces charge, and who says so
Sixty-four readable pages, 37%, link a pricing page from the page we checked. The other 63% leave a buyer or a supplier to guess, or to ask. Only 16, about 9%, said in plain text that listing or joining is free, and 40, 23%, pushed a demo or a sales call as the main next step.
Hiding the price is a choice with a cost on both sides. A supplier who cannot see the commission or subscription before joining often does not join. A buyer who cannot see whether the platform charges them, or only the seller, assumes it does. In our rankings, the platforms that published a fee schedule were also the easiest to recommend, because we could state the cost in one line.
There are good reasons not to publish a full price list: enterprise deals, custom volumes, regional pricing. But a page that explains how you charge (commission, subscription, listing fee or free) with a starting figure answers the question without fixing every number. Our benchmarks of marketplace fees and take rates show what is normal by sector, so you can see where your own pricing sits before you publish it.
Lesson 5: machine-readable pages are still the minority
Structured data is common. 117 of the 173 readable pages, 68%, carry JSON-LD, the format search engines read for organization, product and review details. But only 53, 31%, publish an llms.txt file, the plain-text summary some AI tools read to understand a site.
The best llms.txt files we found were short and factual. Tagvenue's opens by stating that it is a venue-hire B2B marketplace with over 22,000 human-verified venues. Chambers and Partners describes what it ranks and how. Neither file is marketing copy. Each is the paragraph you would want an assistant to repeat about you.
Rendering is the bigger lever. A platform whose listings, counts and prices only appear after scripts run is asking every crawler that does not run them to guess, and the guesses are rarely flattering. Our AI crawler readiness work starts with exactly this check.
Can machines read your B2B marketplace?
A growth audit checks what buyers, search engines and AI assistants can read on your B2B marketplace, and ranks the fixes by what they are worth.
The check itself is simple enough to run today. Request your homepage without a browser, count the words that come back, and look for your headline numbers in the raw text. If the count is low or the numbers read zero, every other investment in content and proof is reaching fewer readers than you think, and the fix belongs at the top of next quarter's list.
The scorecard: what the leaders publish
The table below sets each signal against how common it was, what it tells a reader, and what it costs to leave it out. Use it to compare your own homepage line by line.
| Signal on the homepage | Share of 173 readable pages | What it tells a buyer or assistant | Cost to add | Risk if missing | Best for |
|---|---|---|---|---|---|
| Blog or resources hub | 82% | You publish about the category | Ongoing writing time | Little search traffic to convert | Search reach |
| Structured data (JSON-LD) | 68% | Who you are, in fields machines read | Low, one-off | Weak entity data in search | Search and AI answers |
| A stated reach number | 53% | How big the network is | None, a decision | Adjectives instead of evidence | New supply and buyers |
| Case studies | 42% | Results someone can verify | Moderate, needs clients | Buyers cannot defend the choice | Conversion |
| Pricing page link | 37% | How and what you charge | Low, a decision | Suppliers stall before joining | Supply acquisition |
| llms.txt file | 31% | A plain summary for AI tools | Very low | Assistants describe you in their words | AI answers |
| Demo or sales call as the main step | 23% | A person will help | Sales team time | Self-serve buyers leave | Enterprise deals |
| Review rating shown | 19% | Others vouch for you | Moderate | No third-party trust signal | Trust |
| Both sides counted | 10% | The network is balanced | None, a decision | Each side doubts the other | Liquidity |
| Free listing stated | 9% | Joining costs nothing | None if true | Suppliers assume a fee | Early supply |
The cheapest rows are the rarest. Counting both sides, stating free listing where it is true and publishing an llms.txt file cost almost nothing, yet fewer than a third of platforms do any of them. The expensive rows, content and case studies, are where most teams already spend.
What 64 rankings taught us beyond the homepage
Between October 7 and November 10, 2026, we published 64 industry rankings, named 374 companies and tracked 734 more platforms, counted by unique domain, that fit the same categories. Writing them taught us three things the homepage check cannot show.
First, platforms rarely measure size in a shared unit. Coverage arrived as data centers, firms, carriers, buildings, members or SKUs, which is why we judged 26 of the 64 rankings on network size or coverage, and only 9 on price. Second, verification is underused as a selling point: 19 rankings turned on how a platform vets suppliers, and the platforms that explained their checks clearly were the easiest to rank highly. Third, the leader in most vertical categories is a specialist serving one part of the industry, not a horizontal giant, a pattern our guide to vertical marketplaces explores.
The practical lesson is that the information we needed to rank a platform is the same information a buyer needs to choose it. When a platform's own pages did not state it, we had to look for it in filings, press releases or third-party reviews, and some buyers will simply not bother.
Three failure scenarios
These are illustrative patterns drawn from what we saw, not accounts of named companies. The costs are the kind operators describe, not audited figures.
- The protected shop window. A B2B marketplace for industrial parts turns on its host's bot protection after a scraping incident. Its homepage now returns an error to anything that is not a known browser. Six months later, a procurement lead asks an assistant for parts marketplaces in the category and gets three competitors. The fix, allowing named crawlers and rendering key pages on the server, would have taken days.
- The one-sided counter. A services B2B marketplace leads its homepage with "50,000+ experts" and no client number. Experts sign up, see few requests and leave. The team spends on paid supply acquisition to replace them, when a clear client count and a page showing real demand would have kept more of the first cohort.
- The hidden fee. A data B2B marketplace asks suppliers to book a call to learn its commission. Most do not book. The ones who do are the largest, who negotiate the lowest rate. A published rate card with a volume discount would have kept the long tail and protected the margin on the big accounts.
In each case the platform was good at its core job. The loss came from a page that did not say so, or could not be read. That is the cheapest kind of problem to fix, and the easiest to overlook, because nobody reports a lead that never arrived.
Where to start: a decision framework
Work through these in order and stop at the first one that applies. Each threshold comes from the gaps we measured, and the first one matters most because Google's own guidance says server-side or pre-rendering is still a great idea, since not all bots can run JavaScript (Google Search Central).
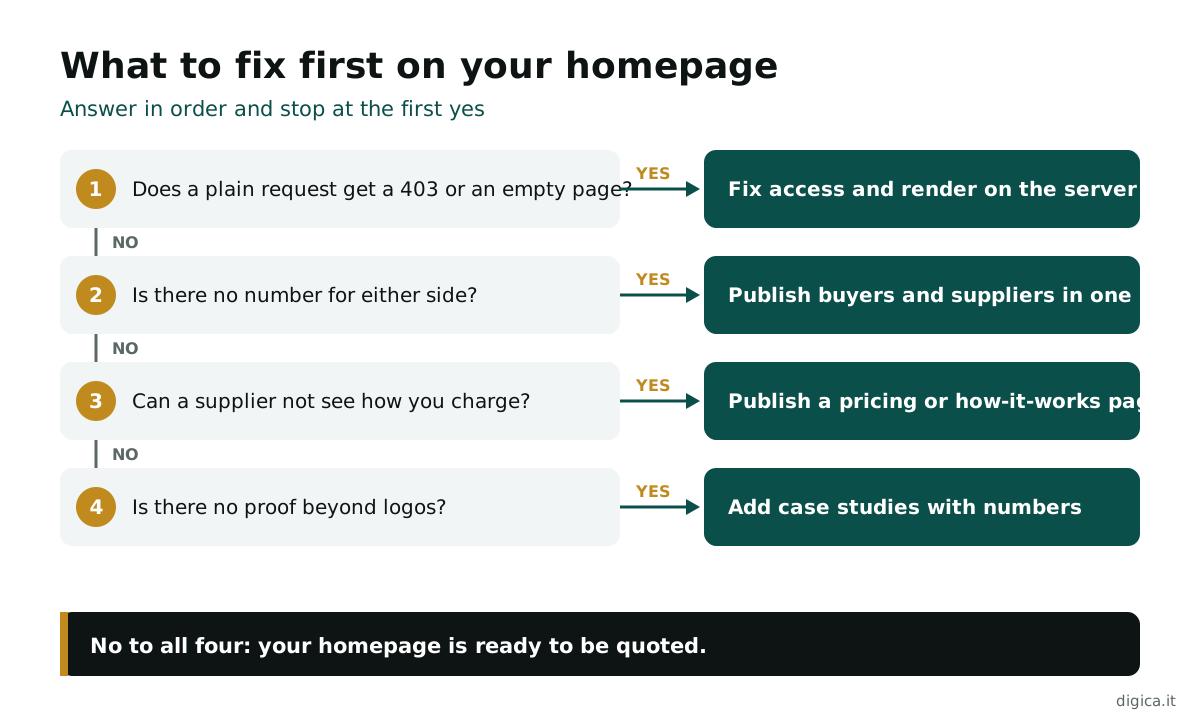
- If a plain request to your homepage returns a 403 or fewer than 150 words of text, fix access and server rendering first. Nothing else on this list helps if the page cannot be read.
- If your homepage has no number for either side, publish one this week, in the unit buyers use to compare you.
- If you count only one side, add the other, even if it is smaller. A real 400 buyers beats an implied million.
- If a supplier cannot see how you charge within two clicks, publish a pricing or how-it-works page with at least a starting figure.
- If you have more than 20 blog posts and fewer than 3 case studies, stop writing articles for a month and write proof.
- If you have no llms.txt file, add a short, factual one. It takes an hour.
The order matters because each step makes the next one count. A reach number on a page nobody can read is wasted, and a case study with no pricing page leaves the reader impressed and unsure what to do next. Our guide to how to grow a B2B marketplace puts these fixes in the wider sequence.
What fixing the homepage is worth
The return depends on how many visitors and suppliers you already reach. Take an illustrative case. A B2B marketplace with 20,000 monthly visitors converts 1% into supplier or buyer signups, 200 a month. If clearer numbers, a pricing page and visible proof lift that to 1.3%, it gains 60 signups a month, or 720 a year, from traffic it already has. If each signup is worth $500 a year in fees, that is about $360,000 of annual revenue from pages, not ad spend. Replace the inputs with your own.
This is the work we do. We grew a B2B agency marketplace from five people to 40,000+ listed agencies and 1M+ monthly users, and helped a water and wastewater marketplace reach 10x+ organic impressions within six months. On authority, our position is simple: "No. We earn editorial placements on real company domains and point them at the pages that convert. No paid directories, no bought links."
Want your B2B marketplace to be the one buyers find first?
We help B2B marketplaces acquire supply, generate demand and get cited in search and AI answers, from the homepage out.
The number to take into your next leadership meeting is the 29%. If your homepage is in that group, you are invisible to some of the readers who decide shortlists, and the biggest cost of doing nothing is that buyers who start their research with a scripted tool or an assistant never reach your page at all. Most of the fixes in this study cost days, not quarters, so the payback is usually measured in weeks once the traffic is there.
FAQ
What is an online B2B marketplace? An online B2B marketplace is a platform where businesses find, compare and buy from other businesses, with many suppliers on one site. Examples range from Alibaba.com and Amazon Business to vertical specialists in freight, chemicals or staffing.
What do successful online B2B marketplaces publish on their homepage? In our check of 243 platforms, the strongest pages stated a reach number for both sides, linked a pricing page and case studies, carried structured data and rendered their text without scripts. Only about 10% counted both sides.
How many B2B marketplaces block crawlers? In our November 2026 check, 70 of 243 B2B marketplace homepages, 29%, returned an error to a plain scripted request, mostly 403 Forbidden. A person in a browser may still see the page, but some crawlers will not.
Should a B2B marketplace publish its pricing? Usually, at least how it charges and a starting figure. Only 37% of the platforms we checked linked a pricing page. Suppliers who cannot see the fee before joining often do not join.
What is an llms.txt file and do B2B marketplaces need one? An llms.txt file is a plain-text summary of a site for AI tools. 31% of the readable B2B marketplaces we checked had one. It costs about an hour and gives assistants an accurate description to repeat.
Where can I find B2B marketplace examples by industry? Our ranking of the biggest B2B marketplaces lists the leaders by buyers and sellers, and our industry rankings cover more than 60 sectors, from load boards to chemical and packaging marketplaces.
Related Articles
- B2B marketplace growth strategy: what works in 2026
- The 7 biggest B2B marketplaces, by buyers and sellers
- Marketplace fees and take rates: B2B benchmarks
- Agentic commerce in B2B: a marketplace readiness guide
- B2B ecommerce statistics 2026: market size and growth, graded by source
Where this connects
This article is part of our B2B marketplace growth series. Browse more on the Digica blog.